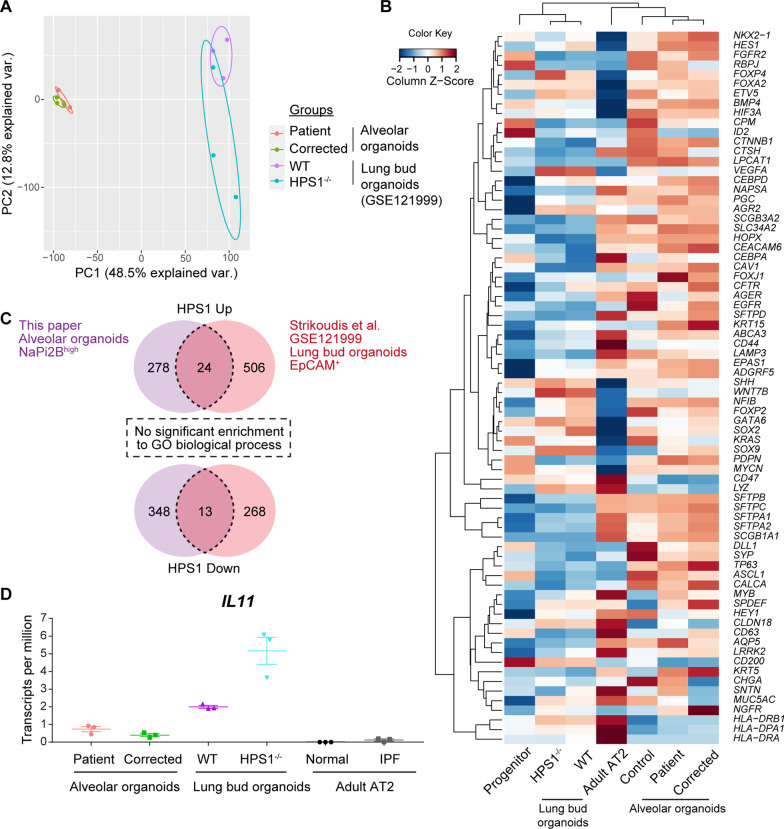
Fig. 4.
Transcriptomic comparison between alveolar organoids (AOs) and lung bud organoids (LBOs) in HPS1-disease models. A Principal component analysis (PCA) of the transcriptomes of AOs and LBOs in HPS1-disease models. Log2 (TPM + 0.01) (transcripts per million) were used for PCA. B Hierarchical clustering based on the expression of lung epithelial cell markers. A heatmap indicating Z-score of each gene. Mean values of log2 (TPM + 0.01) were used to calculate the Z-score. The following data sets were used: CPMhigh progenitor cells, GES163575; Lung bud organoids, GSE121999; Adult AT2 cells, GSE131768; Alveolar organoids, GSE179898 and GSE179899. C Overlapped upregulated or downregulated DEGs on each model and their results of gene ontology enrichment analysis of biological process. D TPM of IL11 on each model. The following data sets were used: adult AT2 cells with normal and IPF conditions, GSE94555

