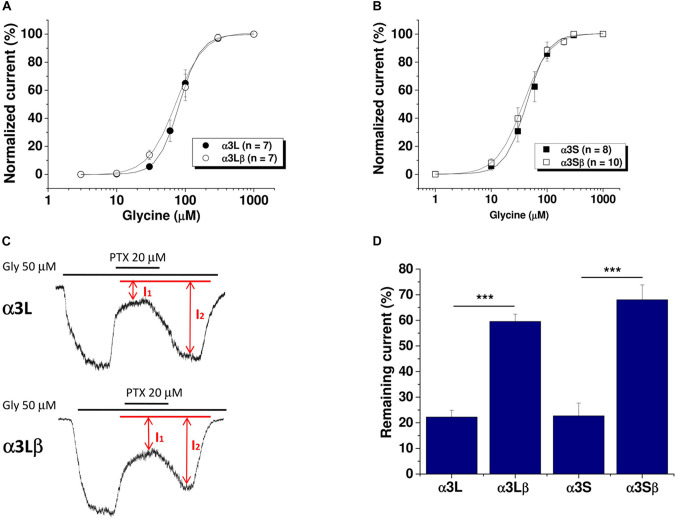
FIGURE 1.
Sensitivity to glycine and picrotoxin of GlyR α3 subunits in HEK293 cells. (A) Concentration-response curves for the GlyR α3L variant in homomeric (n = 7 for α3L) and heteromeric (n = 7 for α3Lβ) receptors. (B) Concentration-response curves for the GlyR α3S isoform in homomeric (n = 8 for α3S) and heteromeric (n = 10 for α3Sβ) receptors. (C) Representative traces of glycine-evoked currents for the α3L and α3Lβ variant in the presence of 20 μM picrotoxin. (D) The graph shows the current that remained during application of picrotoxin for the different isoforms/combinations of GlyR α3 subunits (n = 11 for α3L, n = 10 for α3Lβ; n = 7 for α3S; and n = 5 for α3Sβ). Unpaired Student’s t-test. Data are mean ± SEM. ***p < 0.001.

