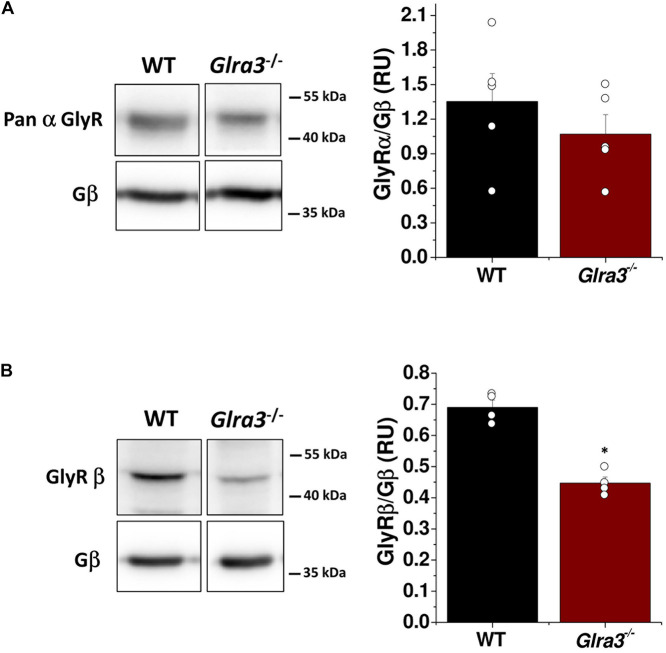
FIGURE 3.
Presence of GlyR α and β subunits in the nAc of WT and Glra3–/– mice. (A) Western blot of lysates from the nAc of WT and Glra3–/– mice for GlyR α and β subunits. The graph shows similar levels of α subunits in Glra3–/– mice compared to WT mice (n = 5 WT and n = 5 Glra3–/–). (B) Western blot and graph show low levels of the β subunit in the Glra3–/– mice compared to WT mice (n = 4 WT and n = 4 Glra3–/–). Unpaired Student’s t-test. Data represent mean ± SEM. ∗p < 0.05.

