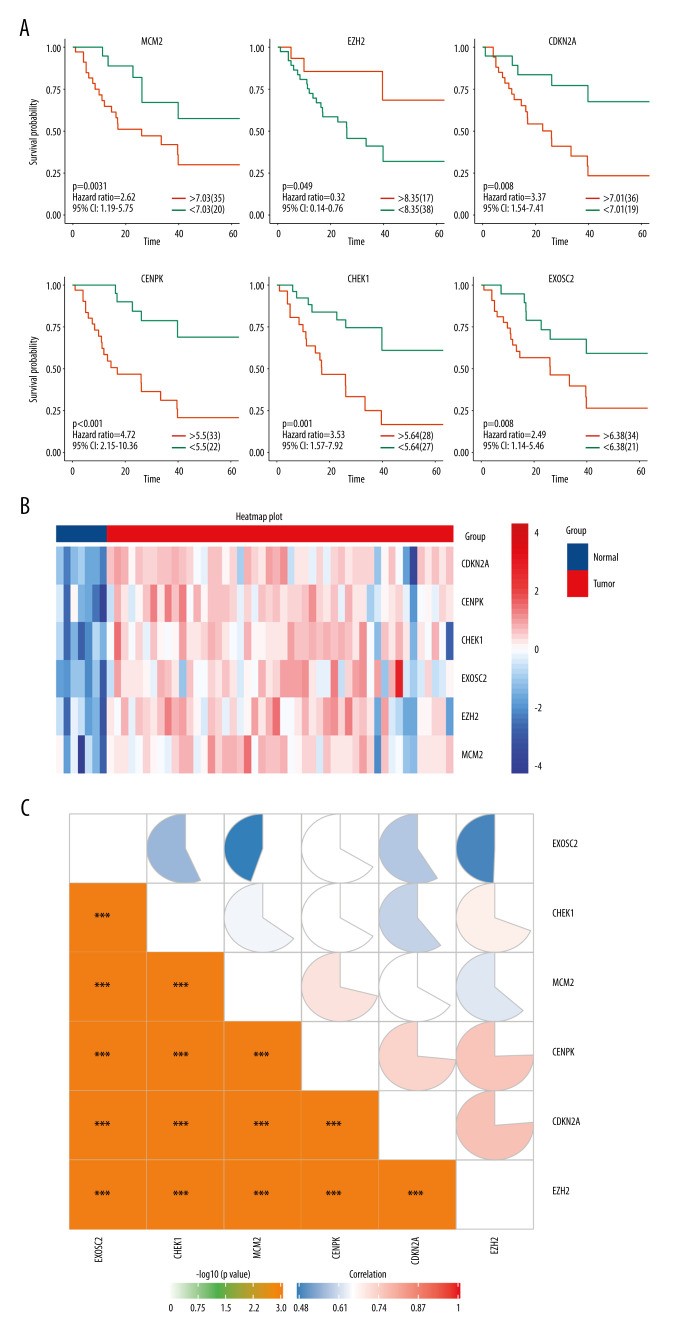
Figure 3.
(A) Overall survival according to the expression of the 6 selected genes modulated in SCLC. (B) Heatmap demonstrated the expression level of 6 selected genes between normal and tumor tissue. (C) Correlation heatmap of the 6 selected genes. R software Version 4.0.0 http://www.r-project.org.

