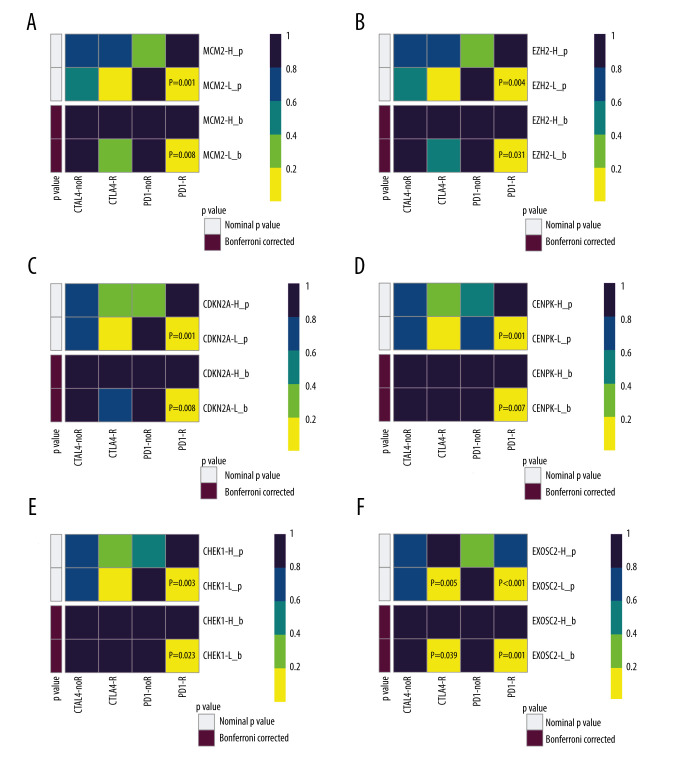
Figure 4.
SubClass Mapping analysis of the 6 key genes to predict the likelihood of response to immune therapy. (A) Low expression of MCM2 was correlated with favorable response to anti-PD-1 treatment. (B) Low expression of EZH2 was correlated with favorable response to anti-PD-1 treatment. (C) Low expression of CDKN2A was correlated with favorable response to anti-PD-1 treatment. (D) Low expression of CENPK was correlated with favorable response to anti-PD-1 treatment. (E) Low expression of CHEK1 was correlated with favorable response to anti-PD-1 treatment. (F) Low expression of EXOSC2 was correlated with favorable response to anti-CTLA4 treatment and anti-PD-1 treatment. R – response; noR – no response; -L – low-expression group of certain gene; -H – high-expression group of certain gene. (R software (Version 4.0.0, http://www.r-project.org)).

