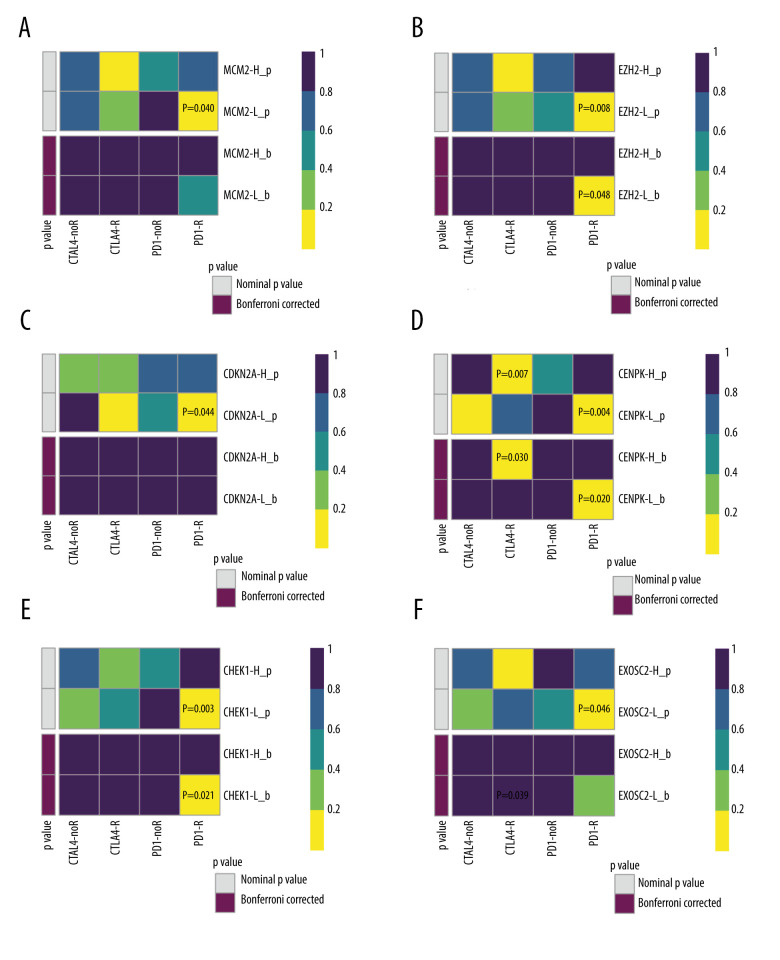
Figure 6.
Validation of the 6 key genes to predict immunotherapeutic response in the CCLE cohort. (A) There was no significant correlation between MCM2 and immune response. (B) Low expression of EZH2 was correlated with favorable response to anti-PD-1 treatment. (C) There was no significant correlation between CDKN2A and immune response (D) Low expression of CENPK was correlated with favorable response to anti-PD-1 treatment. (E) Low expression of CHEK1 was correlated with favorable response to anti-PD-1 treatment. (F) There was no significant correlation between EXOSC2 and immune response. R – response; noR – no response; -L – low-expression group of certain gene; -H – high-expression group of certain gene. (R software (Version 4.0.0, http://www.r-project.org)).

