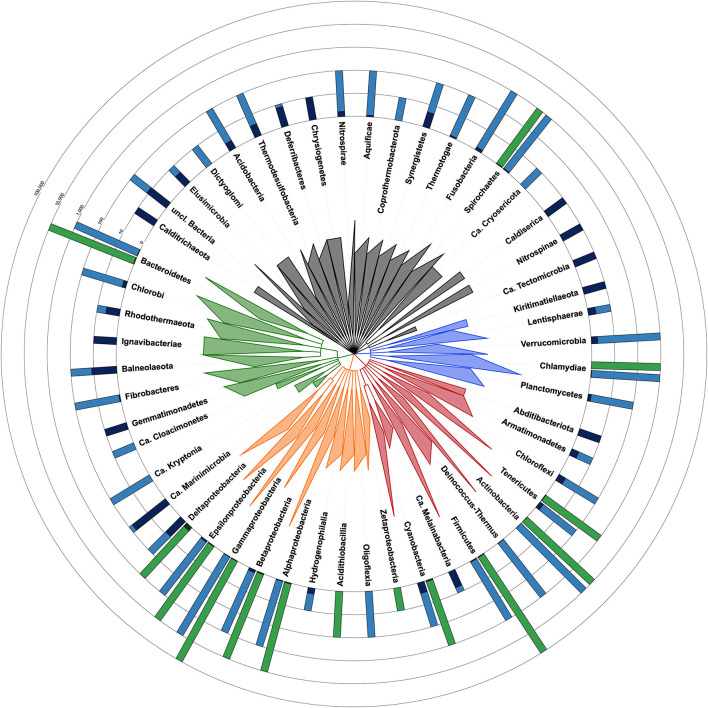
FIGURE 1.
Taxonomic tree of the bacterial domain showing the fraction of contaminated genomes in each phylum with each method. Taxon identifiers of the 111,088 RefSeq bacterial genomes were passed to NCBI Common Tree tools to construct the tree [parameters: (1) include unranked taxa, (2) expand all]. Tree visualization was performed with iTOL and branches were collapsed at the taxonomic levels reported in the tree. Triangles are proportional to taxonomic depth. Proteobacteria are colored in orange, FCB group in green, Terrabacteria in red, PVC group in blue and the other phyla in dark gray. Green barplots are for genomes evaluated with CheckM and blue barplots are for Physeter. The fraction of genomes with a contamination level <5% is shown in a light color whereas those ≥5% are shown in a dark color. The number of genomes evaluated with each method is indicated by the height of the barplot on a ceiled logarithmic scale. For simplicity, the estimates for Ca. Saccharibacteria (2 contaminated and 12 uncontaminated genomes), candidate division NC10 (2 contaminated genomes), Ca. Atribacteria (2 contaminated genomes), and Ca. Bipolaricaulota (1 contaminated genome) are included in unclassified Bacteria. Completely contaminated phyla (e.g., Caldiserica, Nitrospinae, and Kiritimatiellaeota) are generally represented by very few genomes (i.e., one to three genomes). Among the more extensively studied phyla (11 to 37,487 genomes), some appear to be extremely contaminated, such as Balneolaeota, Synergistetes, and Chloroflexi, with, respectively, 54.5, 33.3, 16.9% of contaminated genomes, whereas other phyla are characterized by a very low contamination level, including Cyanobacteria (2.8%), Gammaproteobacteria (0.6%), or Chlamydiae (0.3%).

