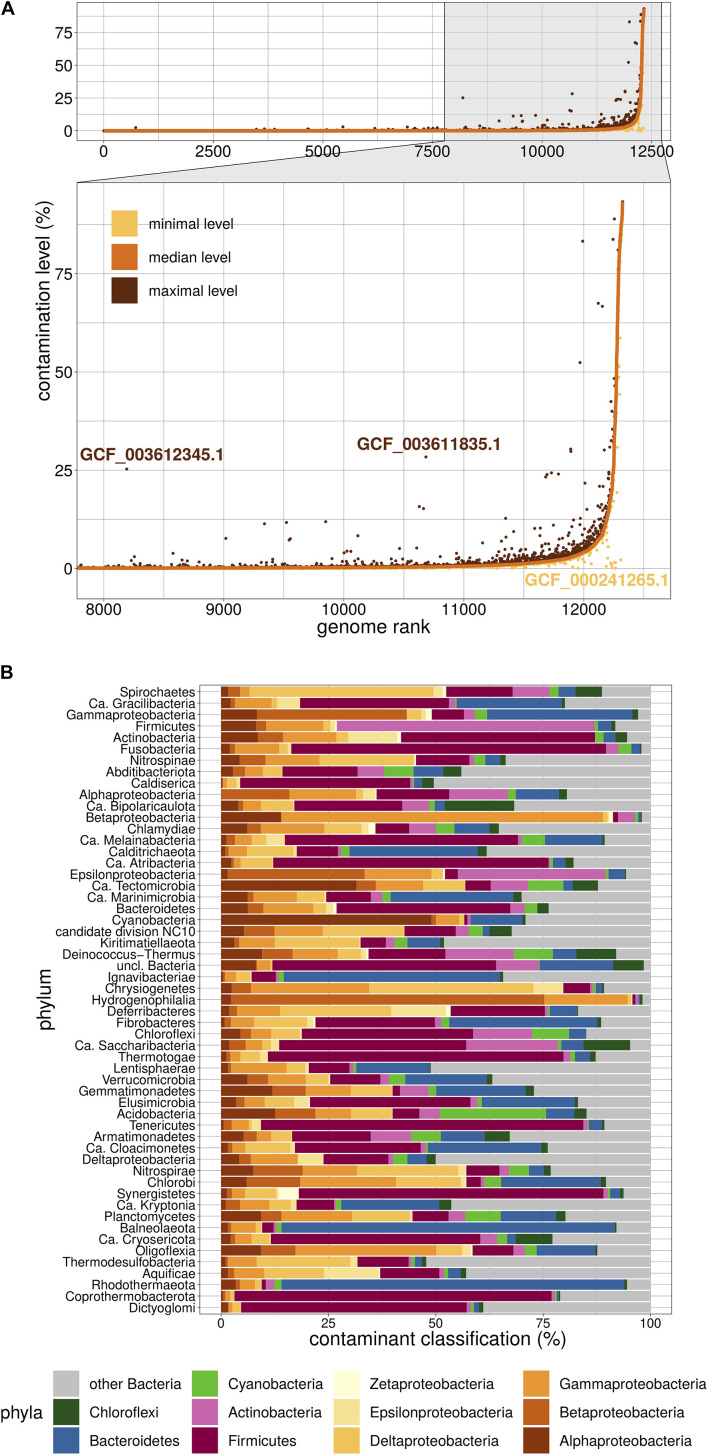
FIGURE 2.
Overview of Physeter properties. (A) Distribution of contamination levels assessed by Physeter in k-fold mode. Genomes are ranked from the lowest to highest median level of contamination. Median levels are shown in a solid orange line, while minimal and maximal levels are represented as yellow and brown dots, respectively. GCF_003612345.1 and GCF_003611835.1 are examples of genomes having a low median level of contamination with some independent estimations showing a higher contamination level. The opposite case is illustrated with GCF_000241265.1. (B) Taxonomic distribution of contaminating sequences within each phylum. The relative contributions of each contaminating phylum were first averaged by genome over all 10 k-folds, then these genome-wise averaged values were averaged by tested phylum over all genomes.

