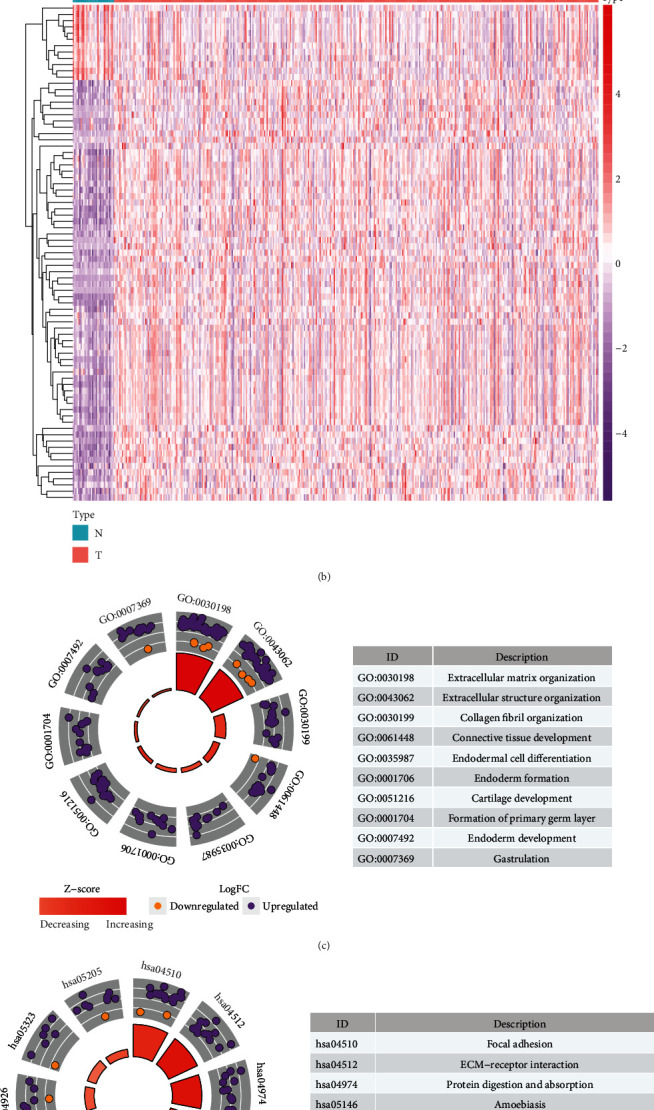
Figure 1.

Identification of dysregulated EMT-related genes, biological functions in gastric cancer. (a) Volcano plot depicting the dysregulated EMT-related genes between gastric cancer and normal tissues. X-axis represents log fold-change, and Y-axis indicates -log10 (adjusted p value). Red and green dots represent up- and downregulated EMT-related genes in gastric cancer, and black dots represent no significant genes. (b) Heatmaps for dysregulated EMT-related genes between tumor and normal tissues. X-axis represents the sample type, and Y-axis depicts dysregulated EMT-related genes. Red and blue show up- and downregulation in gastric cancer, respectively. (c, d) The top ten GO and KEGG terms enriched by dysregulated EMT-related genes.
