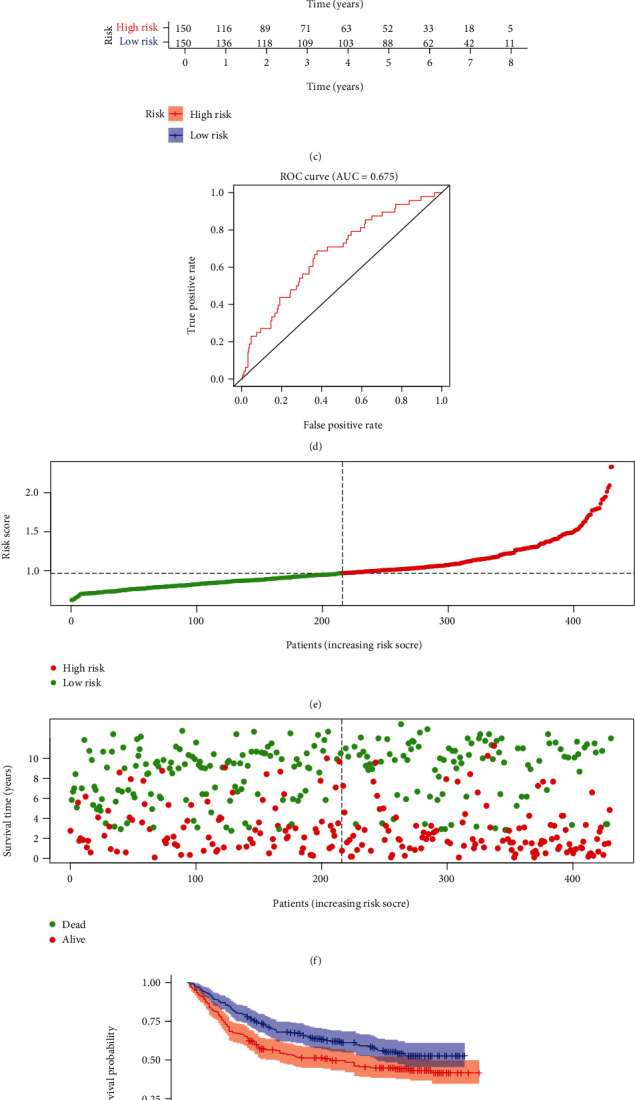
Figure 4.

External validation of the EMT-related RS model in GSE66229 and GSE84437 datasets. (a) Distribution of RS in gastric cancer samples and determination of the cutoff value of high-RS (red) and low-RS (green) groups according to RS median in the GSE66229 dataset. (b) Distribution of survival status (red: dead and green: alive) in high- and low-RS groups in GSE66229 dataset. (c) Kaplan-Meier OS curves of high- and low-RS groups in GSE66229 dataset. (d) ROC curves of the RS model in GSE66229 dataset. (e) Distribution of RS in gastric cancer samples and determination of the cutoff value of high-RS (red) and low-RS (green) groups according to RS median in GSE84437 dataset. (f) Distribution of survival status (red: dead and green: alive) in high- and low-RS groups in GSE84437 dataset. (g) Kaplan-Meier OS curves of high- and low-RS groups in GSE84437 dataset. (h) ROC curves of the RS model in GSE84437 dataset.
