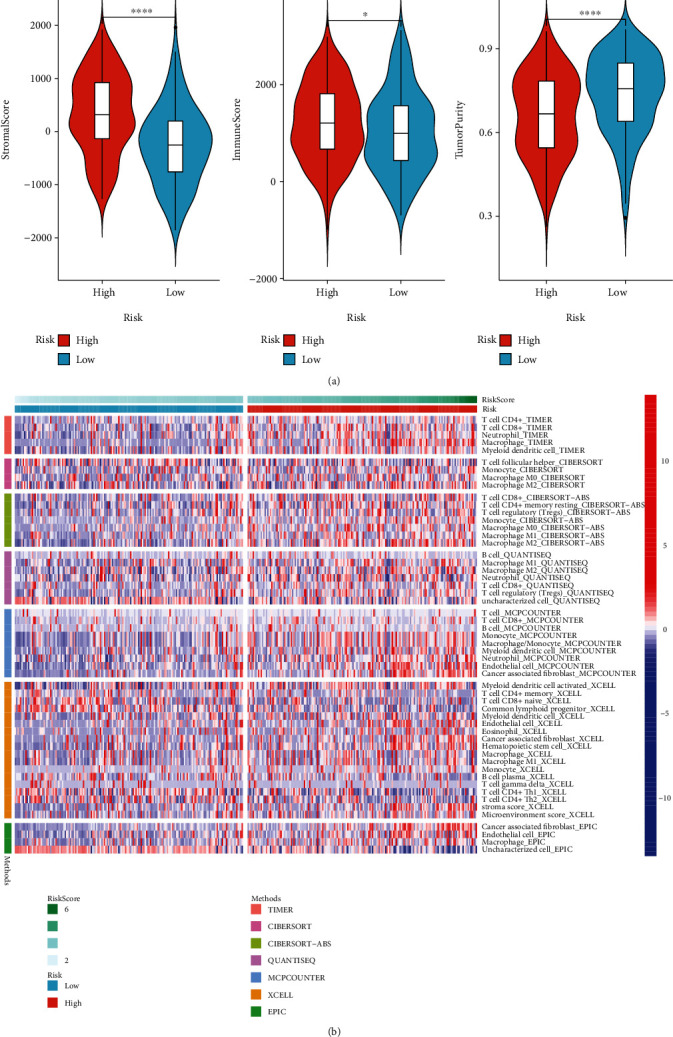
Figure 8.

The relationships between the EMT-related RS model and immune microenvironment of gastric cancer. (a) Violin plots of stromal score, immune score, and tumor purity in high- and low-RS groups. (b) Heatmap showing infiltration levels of immune cells in high- and low-RS groups using seven algorithms including TIMER, CIBERSORT, CIBERSORT-ABS, QUANTISEQ, MCPCOUNTER, XCELL, and EPIC. ∗p < 0.05; ∗∗∗∗p < 0.0001.
