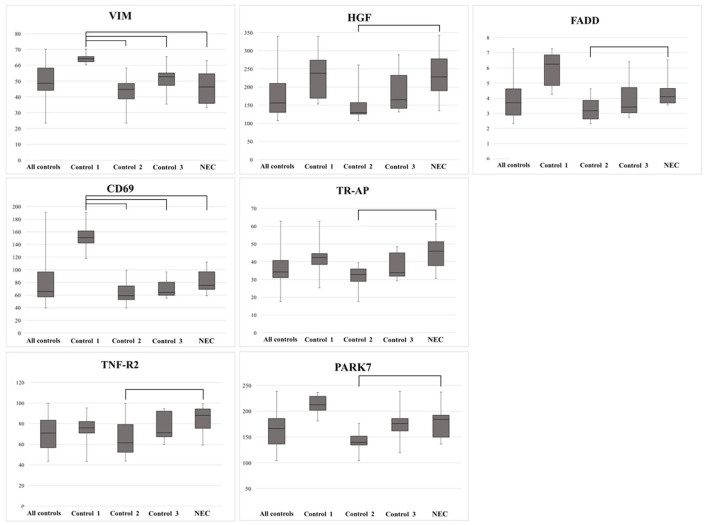
Figure 5.
Biomarkers previously reported linked to necrotizing enterocolitis (NEC) (n = 7), and with the significant difference between Controls 1, 2, and 3 and the NEC group. Note the higher expression of VIM and CD69 in Control 1 compared with the NEC group, and the lower expression of TNF-R2, PARK7, FADD, HGF, and TR-AP in Control 2 compared with the NEC group. Bars depict significant differences.

