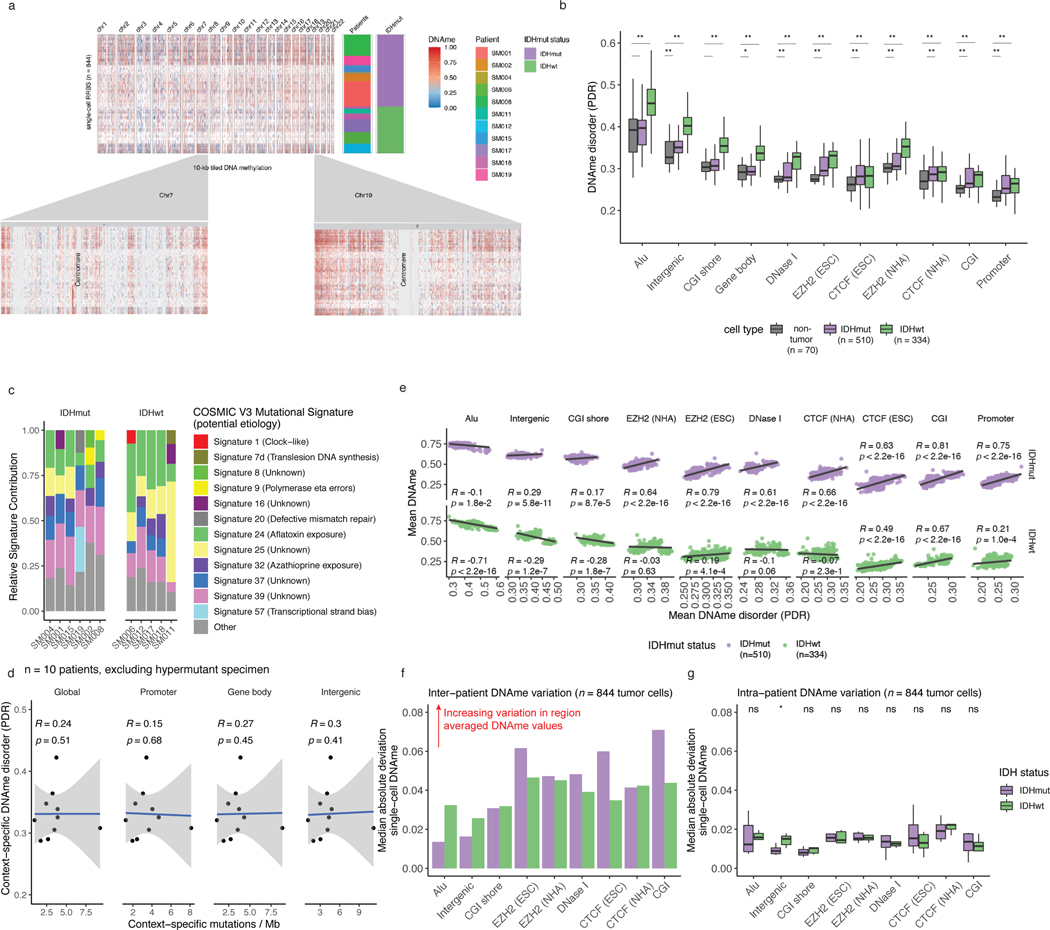
Extended Data Fig. 4. Distribution and relationship of DNAme and DNAme disorder throughout the glioma genome.
a, Visualization of inter-tumoral and intra-tumoral variation in DNAme (10kb tiled DNAme). Genome-level and chromosome-level DNAme across 844 single tumor cells. Each row represents a single cell clustered based on pairwise dissimilarity between methylomes as presented in main Figure 1b and each column represents a single 10kb tile over which DNAme has been averaged as indicated by heatmap color (methylated = red, unmethylated = blue). The tile color for a cell that does not have a measurement for a given tile is represented by white and a tile without a measurement across any cells is represented by grey. Row annotation for both patient identifier and IDH mutation status are presented for each cell. b, Boxplots highlighting the single-cell DNAme disorder estimates calculated across different genomic contexts with Kruskal-Wallis p-values indicating the differences in distributions across the groups. Each box spans the 25th and 75th percentile, center lines indicate the median, and the whiskers represent the absolute range (minima/maxima), excluding outliers. c, The dominant Catalogue of Somatic Mutations in Cancer (COSMIC v3) mutational signatures are presented for each subject. The stacked bar plots represent the relative contribution of each mutational signature to the tumor’s mutational burden. Colors indicate distinct mutational signatures, which are further annotated with their proposed etiology. d, Scatterplots and linear regression lines with standard error showing the relationship between genomic context-specific single-cell DNAme disorder (sample-specific scRRBS average) and genomic context-specific mutation burden derived from whole genome sequencing (n = 10 excluding hypermutant sample). Panels are separated into global (i.e., all regions), promoter, gene body, and intergenic regions (Spearman correlations p > 0.05 for all comparisons). e, Scatterplot and linear regression lines of the context-specific DNAme disorder (x-axis) vs. the average DNAme value (beta-value) for each genomic compartment. Subtype level Spearman correlation coefficients and p-values are presented. f, The median absolute deviation of DNAme across all cells from the same subtype (inter-patient heterogeneity) and g, all cells from the same patient (intra-patient heterogeneity). Two-sided Wilcoxon rank sum tests comparing median absolute deviation levels between IDHmut and IDHwt are presented for intra-patient DNAme heterogeneity.

