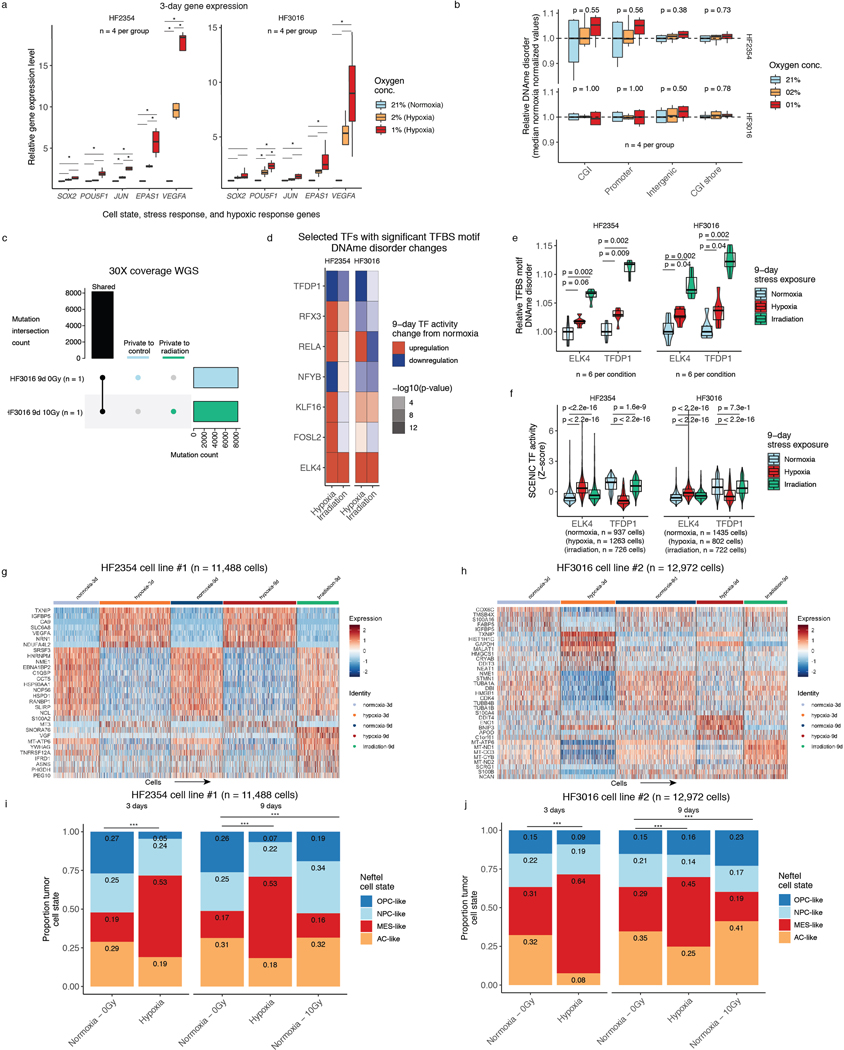
Extended Data Fig. 8. Stress-associated changes in DNAme disorder are associated with altered population-level transcriptional dynamics and not related with genetic changes.
a, Relative gene expression levels for two patient-derived glioma sphere-forming cells for candidate genes reflecting cell state (SOX2, POU5F1) and cell stress (JUN, EPAS1 (HIF2A), VEGFA) via RT-PCR. Normoxia and varying levels of hypoxia (2% and 1% oxygen, n = 4 per group) were assessed. Statistical significance (p < 0.05, Tukey HSD) is indicated by an asterisk, b, Relative DNAme disorder in hypoxia conditions (2% and 1%) compared with normoxia. P-values for Kruskal-Wallis tests are presented across specific genomic contexts (n = 4 per group), c, Upset plot of shared mutations for a randomly selected replicate from cell line HF3016 cultured under normoxia and irradiation (10 Gy). Mutations were determined in reference to subject normal blood. The mutational overlap is presented by the black bar with the mutations called private to irradiation and control also presented, d, Heatmap representing transcription factors that were determined to have consistently different TFBS motif DNAme disorder levels in stress conditions (hypoxia and irradiation) compared with controls across both cell lines (p < 0.1 two-sided Wilcoxon rank sum test across all cell lines and two stressors) are presented with their change in inferred TF activity (SCENIC, methods), e-f, ELK4 and TFDP1 are presented for TFBS motif DNAme disorder (RRBS) and TF activity (scRNAseq), which demonstrated consistent changes in TFBS motif DNAme disorder and stress altered TF activity. Each box spans the 25th and 75th percentile, center lines indicate the median, and the whiskers represent the absolute range (minima/maxima), excluding outliers. Violins surrounding boxplots reflect distributions. Two-sided Wilcoxon rank sum test p-values are presented, g-h, scRNAseq scaled gene expression heatmaps for the top 5 differentially expressed genes per stress exposure and time point, i-j, Stacked bar plots comparing the cell state proportions for the Neftel et al. proliferation-independent IDHwt classifier across different stress conditions, time points, and cell lines. Statistical differences are presented for Chi-Square test (*** = p < 0.001).

