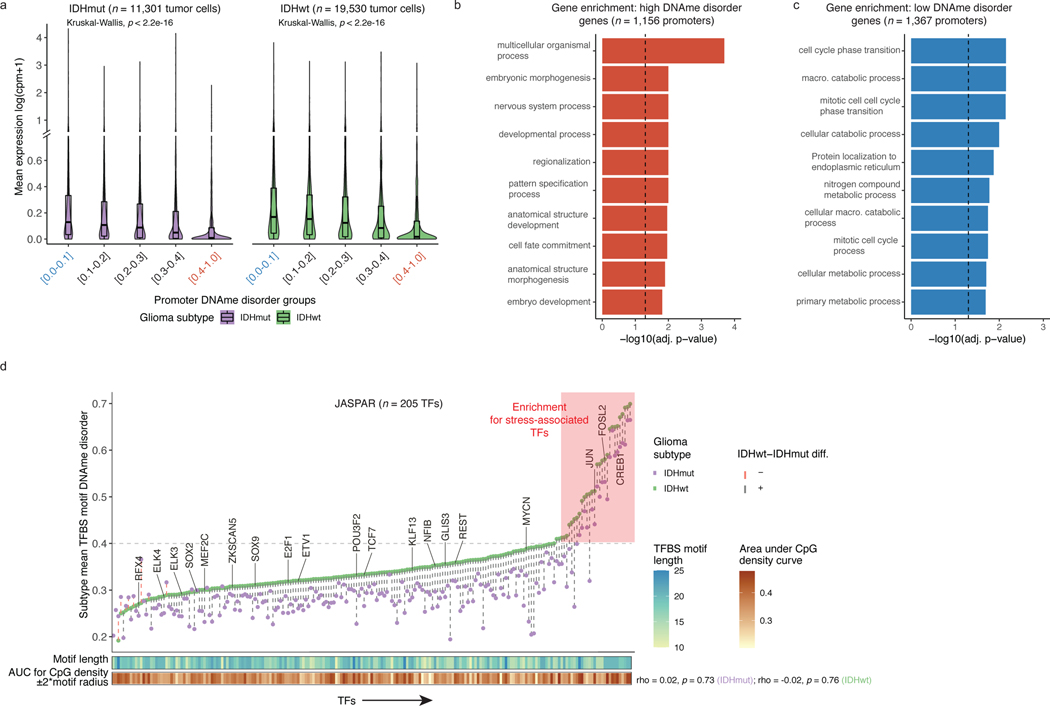
Figure 2. DNAme disorder at gene regulatory elements is associated with cell identity and stress response pathways.
a, Boxplots of gene expression values from single-cell RNAseq data across different promoter DNAme disorder groups. Each box spans the 25th and 75th percentile, center lines indicate the median, and the whiskers represent the absolute range (minima/maxima), excluding outliers. Surrounding violins represent the distribution for each condition. Kruskal-Wallis rank sum test p-values are presented for each subtype. The y-axis includes a line break to improve visibility of violin tails. b-c, Gene Ontology enrichment analyses for b, high DNAme disorder genes and c, low DNAme disorder genes using promoter DNAme disorder values with correction for false discovery rate. d, Scatterplot of mean single-cell DNAme disorder calculated across transcription factor binding site (TFBS) motifs within IDH subtype, ordered by IDHwt TFBS motif DNAme disorder. Each column represents a single transcription factor (TF) with a colored dotted line connecting IDHmut and IDHwt values. Names of TFs previously indicated to confer fitness advantages to glioma cells (MacLeod et al.)35 are listed above their TFBS motif DNAme disorder estimate. TFs with high DNAme disorder are shaded in red and annotation tracks are provided for motif length and motif CpG density (CpG density AUC within ±2*motif radius). P-values represent Spearman correlation for IDHmut (p=0.73) and IDHwt (p=0.76).

