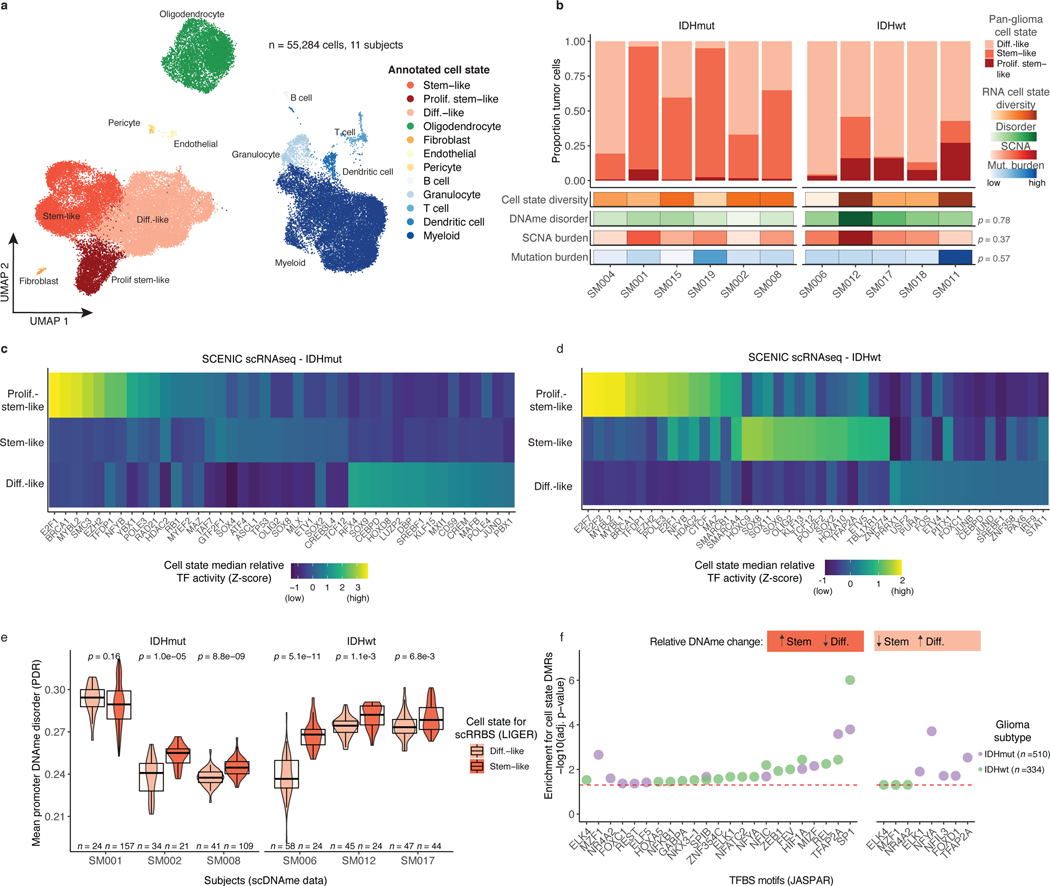
Figure 3. Integrative single-cell gene expression and DNAme analyses nominate epigenetic regulators of glioma cell state variability.
a, Uniform Manifold Approximation and Projection (UMAP) dimensionality reduction plot of scRNAseq data (n = 55,284 cells, n = 11 subjects) showing the clustering of cell populations by transcriptionally defined cell state (point color) and labelled according to marker gene expression (Extended Data Fig. 6b). b, Stacked bar plots representing the proportion of cellular states per tumor for pan-glioma malignant cell classification. Each sample is annotated with molecular metrics with p-values indicating the relationship between cell type diversity, measured by Shannon’s entropy, and sample mean DNAme disorder, whole-genome sequencing derived somatic alteration burden, or whole-genome sequencing derived somatic mutation burden (Spearman correlation). c-d, Enriched transcription factor activity across pan-glioma cellular states determined using SCENIC algorithm and displayed as a heatmap of cell state median relative z-scores. Visualization is presented for the top 15 most active TFs of 5,000 randomly downsampled tumor cells in both c, IDHmut and d IDHwt. e, Promoter DNAme disorder for tumors with at least 10 cells per inferred cell state. Each box spans the 25th and 75th percentile, center lines indicate the median, and the whiskers represent the absolute range (minima/maxima), excluding outliers. Surrounding violins represent the distribution for each condition. Two-sided Wilcoxon rank sum test p-values are presented for each tumor. f, Region set enrichment analysis for differentially methylated regions (DMRs, 10-kb tiles) with higher DNAme in Stem-like (left panel) or Differentiated-like cells (right panel). Enrichment was determined by Locus Overlap Analysis (LOLA). Individual points represent enrichment of specific TFs in differentially methylated regions, color indicates results for specific IDH subtype, and dotted line represents the statistical significance threshold (adj. p-value < 0.05).

