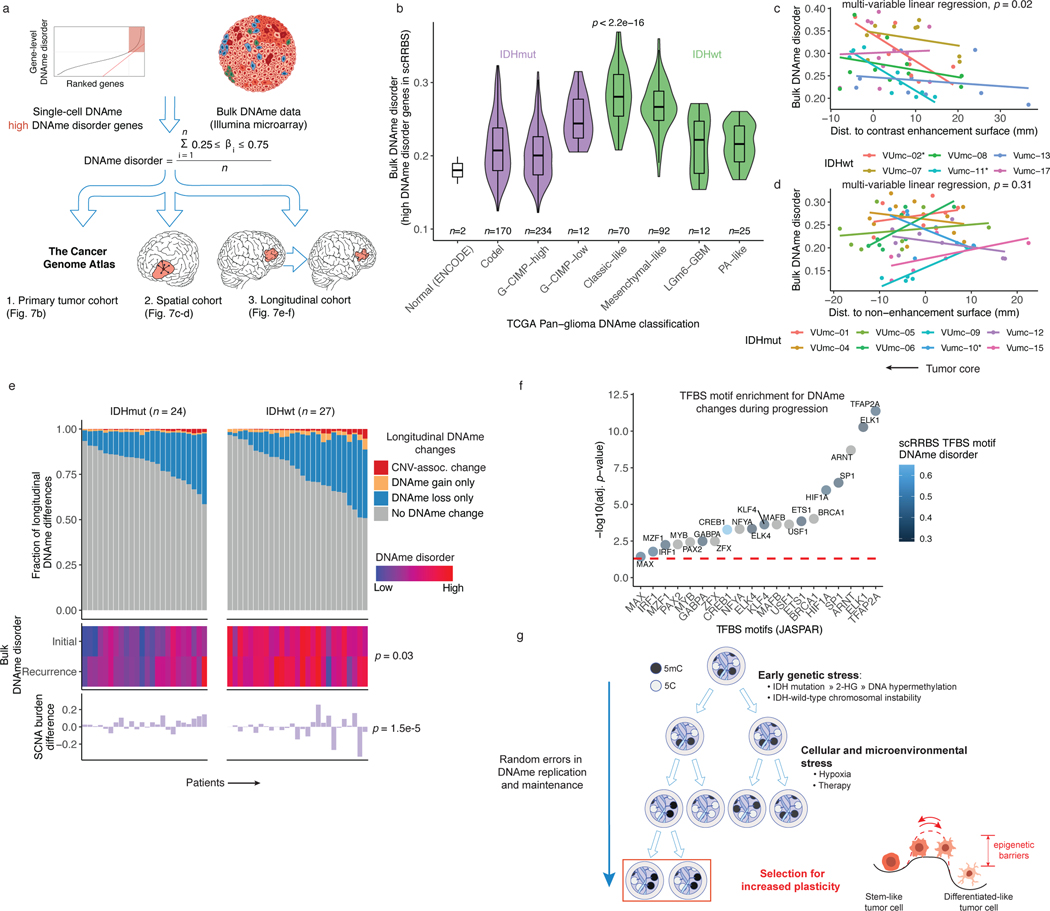
Figure 7. Integrated molecular trajectories support adaptive DNAme changes under microenvironmental and therapeutic stress.
a, Workflow for construction of a DNAme disorder metric in bulk cohorts informed by regions of high DNAme disorder in single-cell DNAme data. b, Boxplots with surrounding violins displaying the bulk DNAme disorder metric calculated across previously described DNA-methylation based TCGA classifications2 and ENCODE normal cell types (astrocyte and embryonic stem cell). Each box spans the 25th and 75th percentile, center lines indicate the median, and the whiskers represent the absolute range (minima/maxima), excluding outliers. Violins represent the distribution for each condition. Kruskal-Wallis test for differences in distributions across classification is reported (n = 615 primary gliomas, p < 2.2e-16). c-d, Scatterplots depicting distance from radiographic features plotted against the DNAme disorder. Colors represent spatially separated biopsies from a single patient at initial clinical timepoint for c, IDHwt tumors (n = 57 biopsies, n = 6 subjects) and d, IDHmut tumors (n = 62 biopsies, n = 8 subjects). Linear regression lines colored by patient demonstrate the relationship between DNAme disorder and radiographic features (i.e., contrast enhancement surface). The p-value reported from a multivariable linear regression model adjusting for subject represents the subtype-specific association between DNAme disorder and radiographic feature. * indicates patient-specific correlation p < 0.05 (Spearman correlation). Biopsies taken closer to the tumor’s center (i.e., core) have the lowest value. e, Each column represents an individual patient sampled across initial and recurrent timepoints and is separated into IDHmut (n = 24 subjects) and IDHwt (n = 27 subjects). Top panel, stacked bar plot represents the proportion of CpGs sites that experienced DNAme change. All associated p-values represent Spearman correlations between absolute change in associated metric and the fraction of longitudinal DNAme differences. f, Enrichment analysis for differentially methylated CpGs between initial and recurrent time points when adjusting for cellular composition, glioma subtype, and subject. Individual points represent enrichment of specific TFs in differentially methylated positions, color indicates the average TFBS motif DNAme disorder from single-cell RRBS data (Figure 2d), and dotted line represents the statistical significance threshold (adj. p-value < 0.05). g, Model of DNAme disorder, stress adaptation, eroded epigenetic barriers, plasticity, and glioma evolution.

