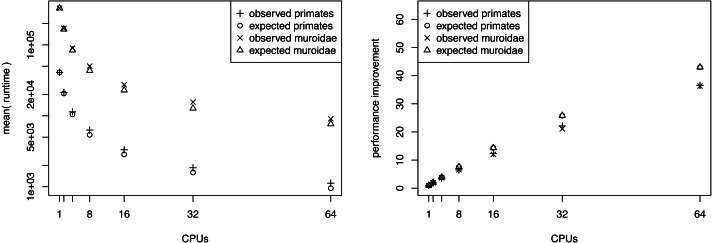
Figure 3. The average runtime of a marginal likelihood estimation on a simple phylogenetic model recorded over 10 repeated runs.
The analyses were performed on the San Diego supercomputer cluster Gordon using 1, 2, 4, 8, 16, 32 and 64 CPUs. The runtimes were measured in seconds. The left graph shows the mean runtime as a function of the number of CPUs. The right graph shows the performance increase (fraction of time needed) compared with a single CPU. Both graphs show the actual performance increase and the expected performance increase (if there were no overhead between CPUs).

