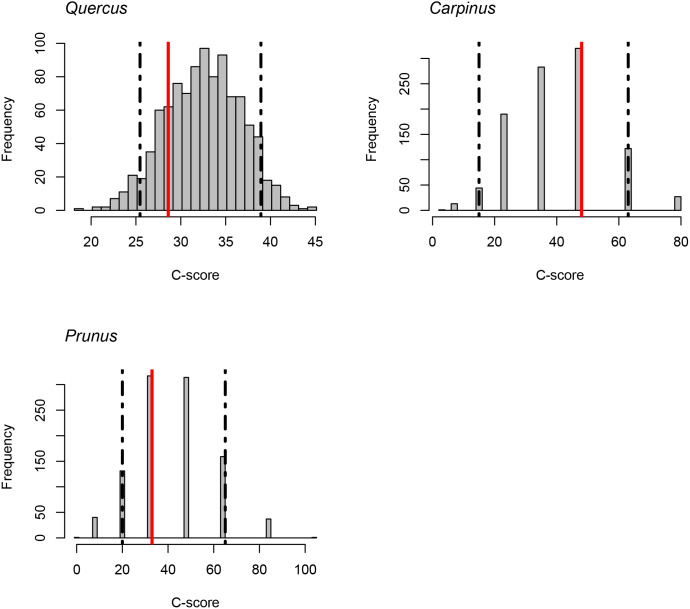
Figure 4. C-scores (checkerboard score; Stone & Roberts, 1990) for the genera Quercus, Carpinus and Prunus.
Red lines indicate the observed C-score. Histograms indicate the null model distribution. Broken lines indicate the 95% (upper and lower) confidence intervals of the null model distribution.

