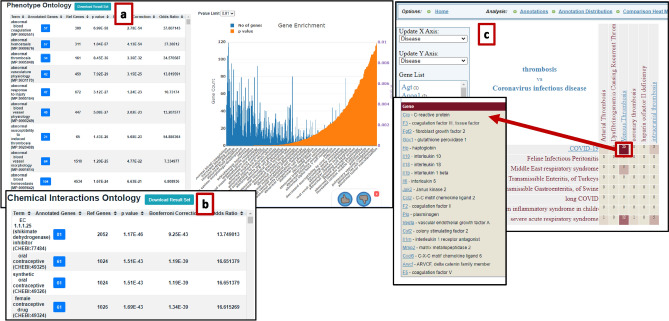
Fig. 8.
Using functional analysis tools from the RGD toolkit to interrogate the thrombosis gene list: Within the Cardiovascular Disease Portal, with the specific disease selection for thrombosis, one finds 139 genes annotated in rat, as detailed in Fig. 5 and Online Resource 1. a Selecting “mouse” and choosing “MP: Phenotype Ontology” enrichment launches an analysis that utilizes MOET; b selecting “rat” and “CHEBI: Chemical/Drug Enrichment” alters the results accordingly; c downloading the gene list into Excel and entering it into the Gene Annotator (GA) Tool will return all annotations in any ontology selected and provide a feature of the GA tool that can generate a comparative heatmap of the genes in the intersections between and within ontologies. Here, we show the resultant heatmap of genes for the intersection of disease ontology child terms for thrombosis and Coronavirus infectious disease. For more detailed steps, see Online Resource 3

