Figure 5.
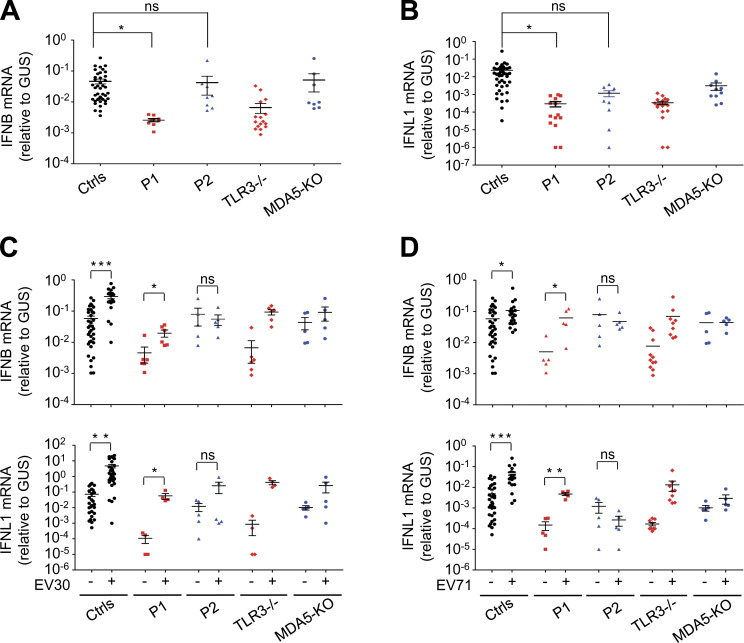
Impaired basal or virus-induced IFN production in TLR3- or MDA5-deficient fibroblasts. (A and B) mRNA levels for IFNB (A) and IFNL1 (B) in unstimulated SV40-fibroblasts from three healthy controls (Ctrls), P1, P2, a TLR3−/− patient, and MDA5 KO SV40-fibroblasts, as quantified by RT-qPCR. (C and D) mRNA levels for IFNB and IFNL1, as assessed by RT-qPCR, in SV40-fibroblasts from three healthy controls (Ctrls), P1, P2, a TLR3−/− patient, and MDA5 KO SV40-fibroblasts, without viral infection, or following 24 h of infection with EV30 (C) or EV71 (D) at an MOI of 5. Data shown are from five independent experiments, with two biological replicates from each experiment (A and B), or three biological replicates from each experiment for the controls and one biological sample from each experiment for the patient-specific cell lines (C and D). Mean values ± SD were calculated from five independent experiments. P values were obtained by one-way ANOVA and subsequent least significant difference multiple comparison tests (A and B) or paired samples t test (C and D). ns, P > 0.05; *, P < 0.05; **, P < 0.01; ***, P < 0.001.

