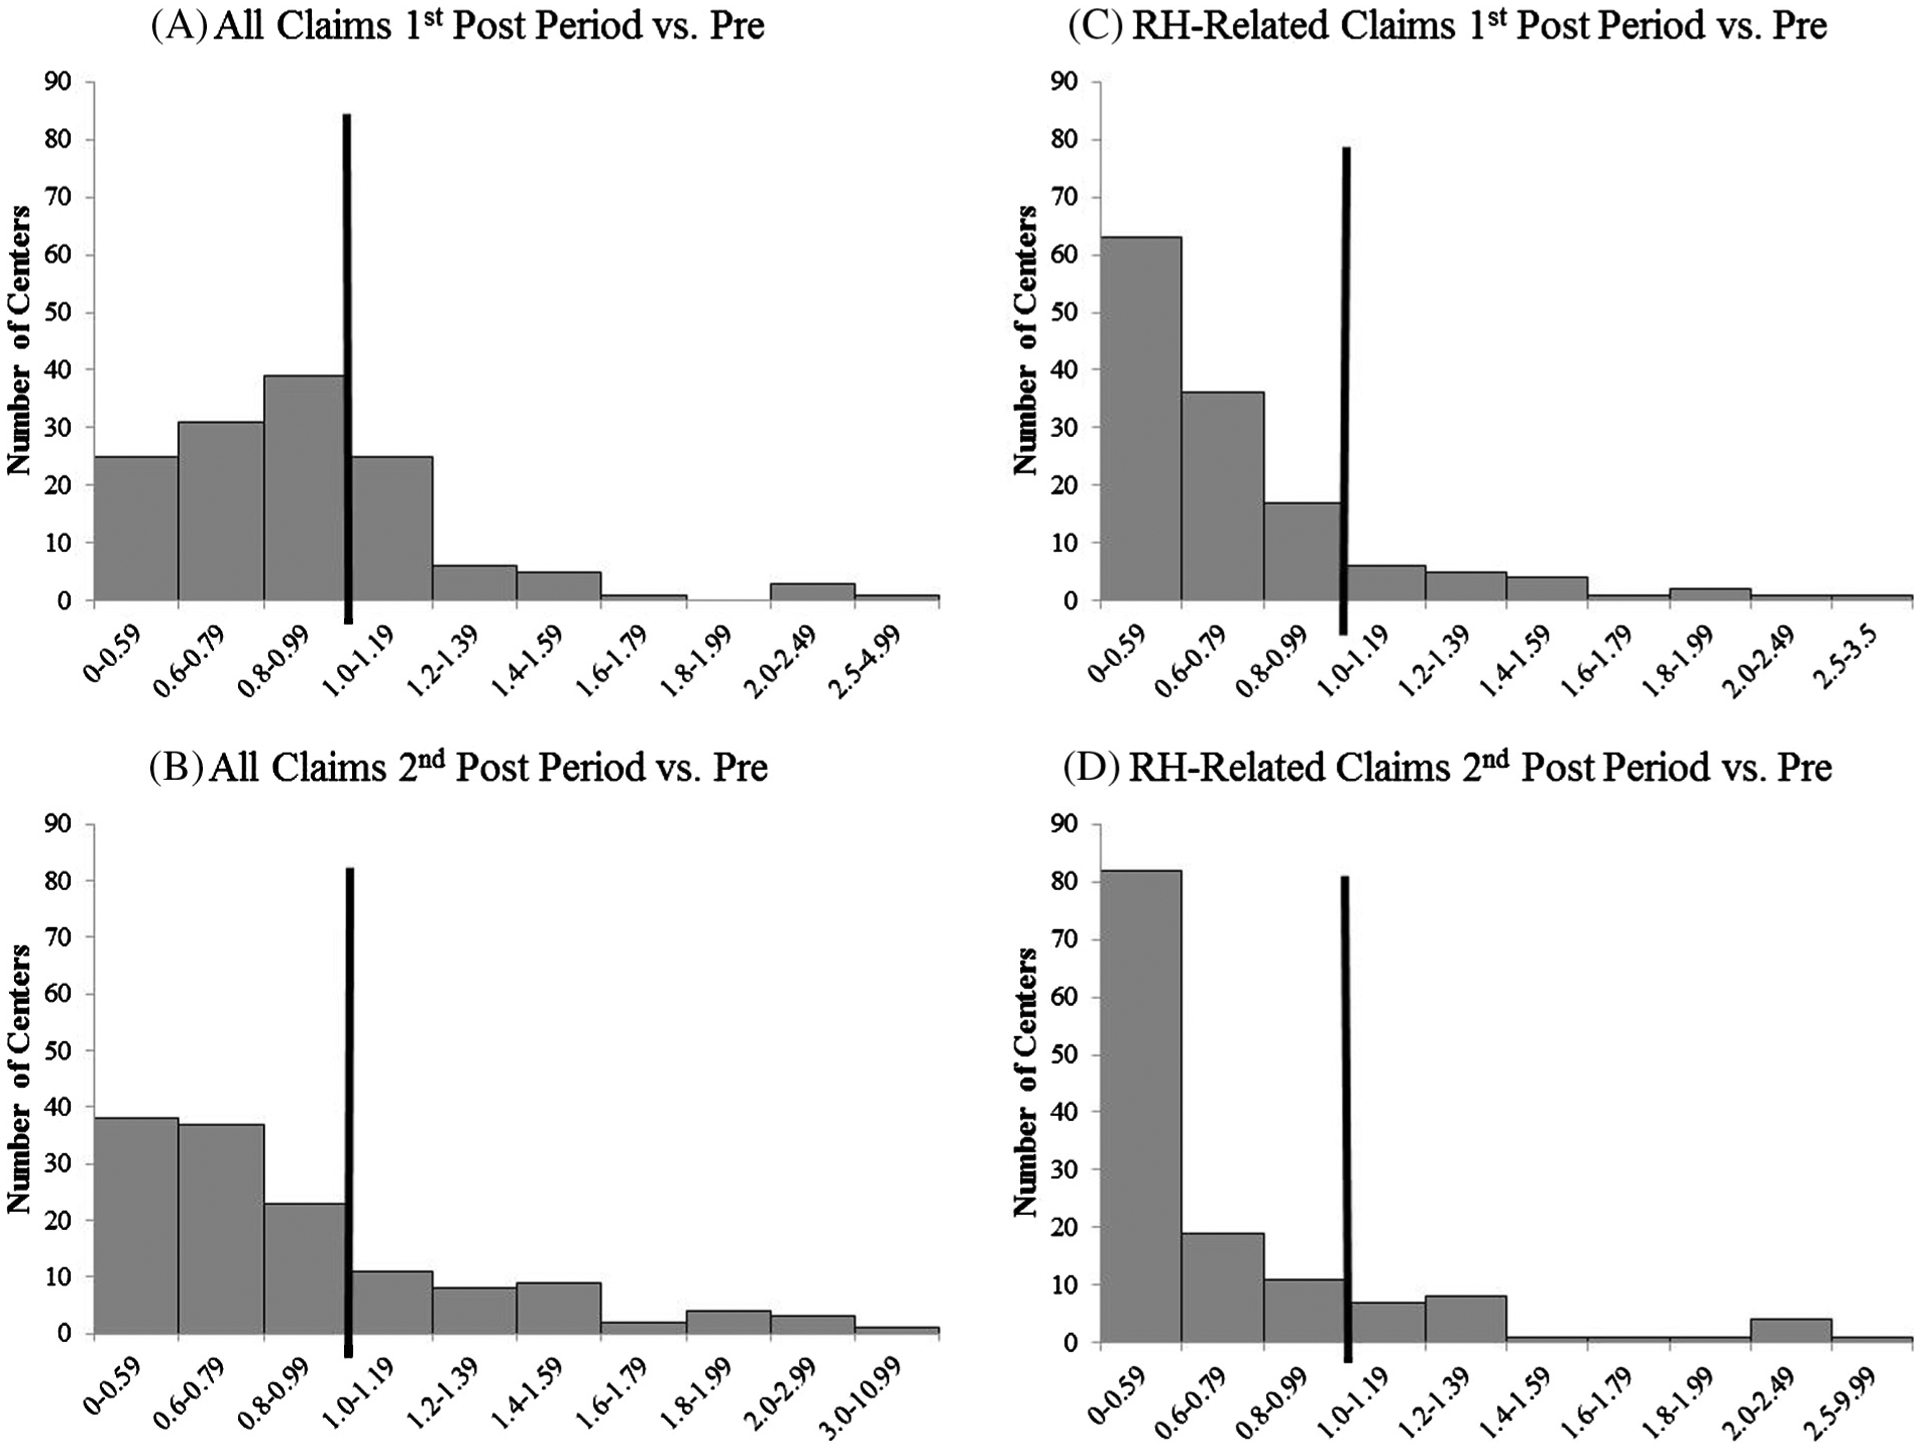
Fig. 1.

Distribution of workers’ compensation claim rates by center (n = 136): (A) all claims first post period vs. pre-SRHP; (B) all claims second post period vs. pre-SRHP; (C) resident handling-related claims first post period vs. pre-SRHP; and (D) resident handling-related claims second post period vs. pre-SRHP.
