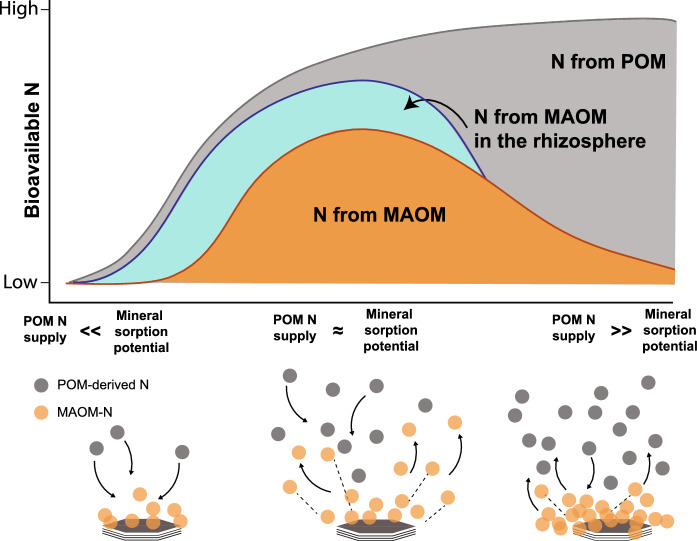
Fig. 2.
Conceptual illustration of how soil bioavailable N and its source (POM vs. MAOM) depend on the ratio of the incoming supply of POM-N to mineral sorption potential, defined as net sorption (i.e. greater gross sorption than gross desorption) of organic N. Stacked curves depict the amount of bioavailable N derived from POM sources (gray), MAOM sources in bulk soil (orange), and MAOM sources under the influence of plant-microbe interactions in the rhizosphere (turquoise). Low POM N supply relative to mineral sorption potential (POM N supply << Mineral sorption potential) will favor sorption and result in low N bioavailability. Bioavailable N from MAOM peaks in soils where POM N supply and mineral sorption potential are in relative balance and overall N bioavailability is moderate-to-high (POM N supply ≈ Mineral sorption potential). High relative POM N supply makes POM the principal
source of bioavailable N and results in high N bioavailability (POM N supply >> Mineral sorption potential). The specific dynamics of bioavailable N will vary depending on the physical and chemical properties of POM and MAOM, total SOM content, soil mineralogy, and the specific nature of microbial communities and plant-soil interactions. (Color figure online)

