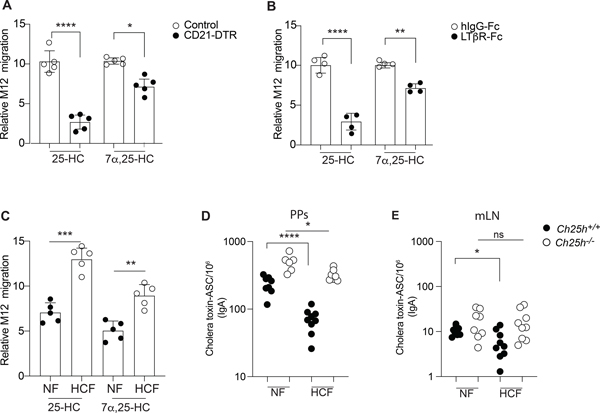
Figure 3. FDCs and diet impact tissue 25-HC levels and control IgA response.
(A) CD21-DTR and littermate control mice were reconstituted with WT bone marrow and treated with diphtheria toxin for 16hrs: lipids were extracted from Peyer’s patches for 25-HC measurement using transwell migration assay with EBI2+ M12 cells. (B) Transwell migration assay of EBI2+ M12 cells in response to lipid extracted from Peyer’s patches of wild type mice treated with recombinant LTβR-FC or isotype control. (C) Relative migration of EBI2+ M12 cells exposed to Peyer’s patches lipid extracts of wild type mice treated for 1 weeks with 0.15 % High cholesterol diet (Western diet-HCF) or normal chow (NF). (D,E) Total number of cholera toxin-specific ASC detected by ELISPOT in mesenteric lymph nodes and Peyer’s patches from Ch25h−/− and littermate control fed with mice NF or 0.15% of HCF. Results are pooled from 3 or 4 independent experiments. ns=non-significant, *p<0.05, **p<0.01,*** p<0.005, ****p<0.001 (unpaired Student’s T test) in (A,B,C) and ns=non-significant, *p<0.05, **p<0.01,***p<0.005, ****p<0.001 (two-way ANOVA) in (D,E).

