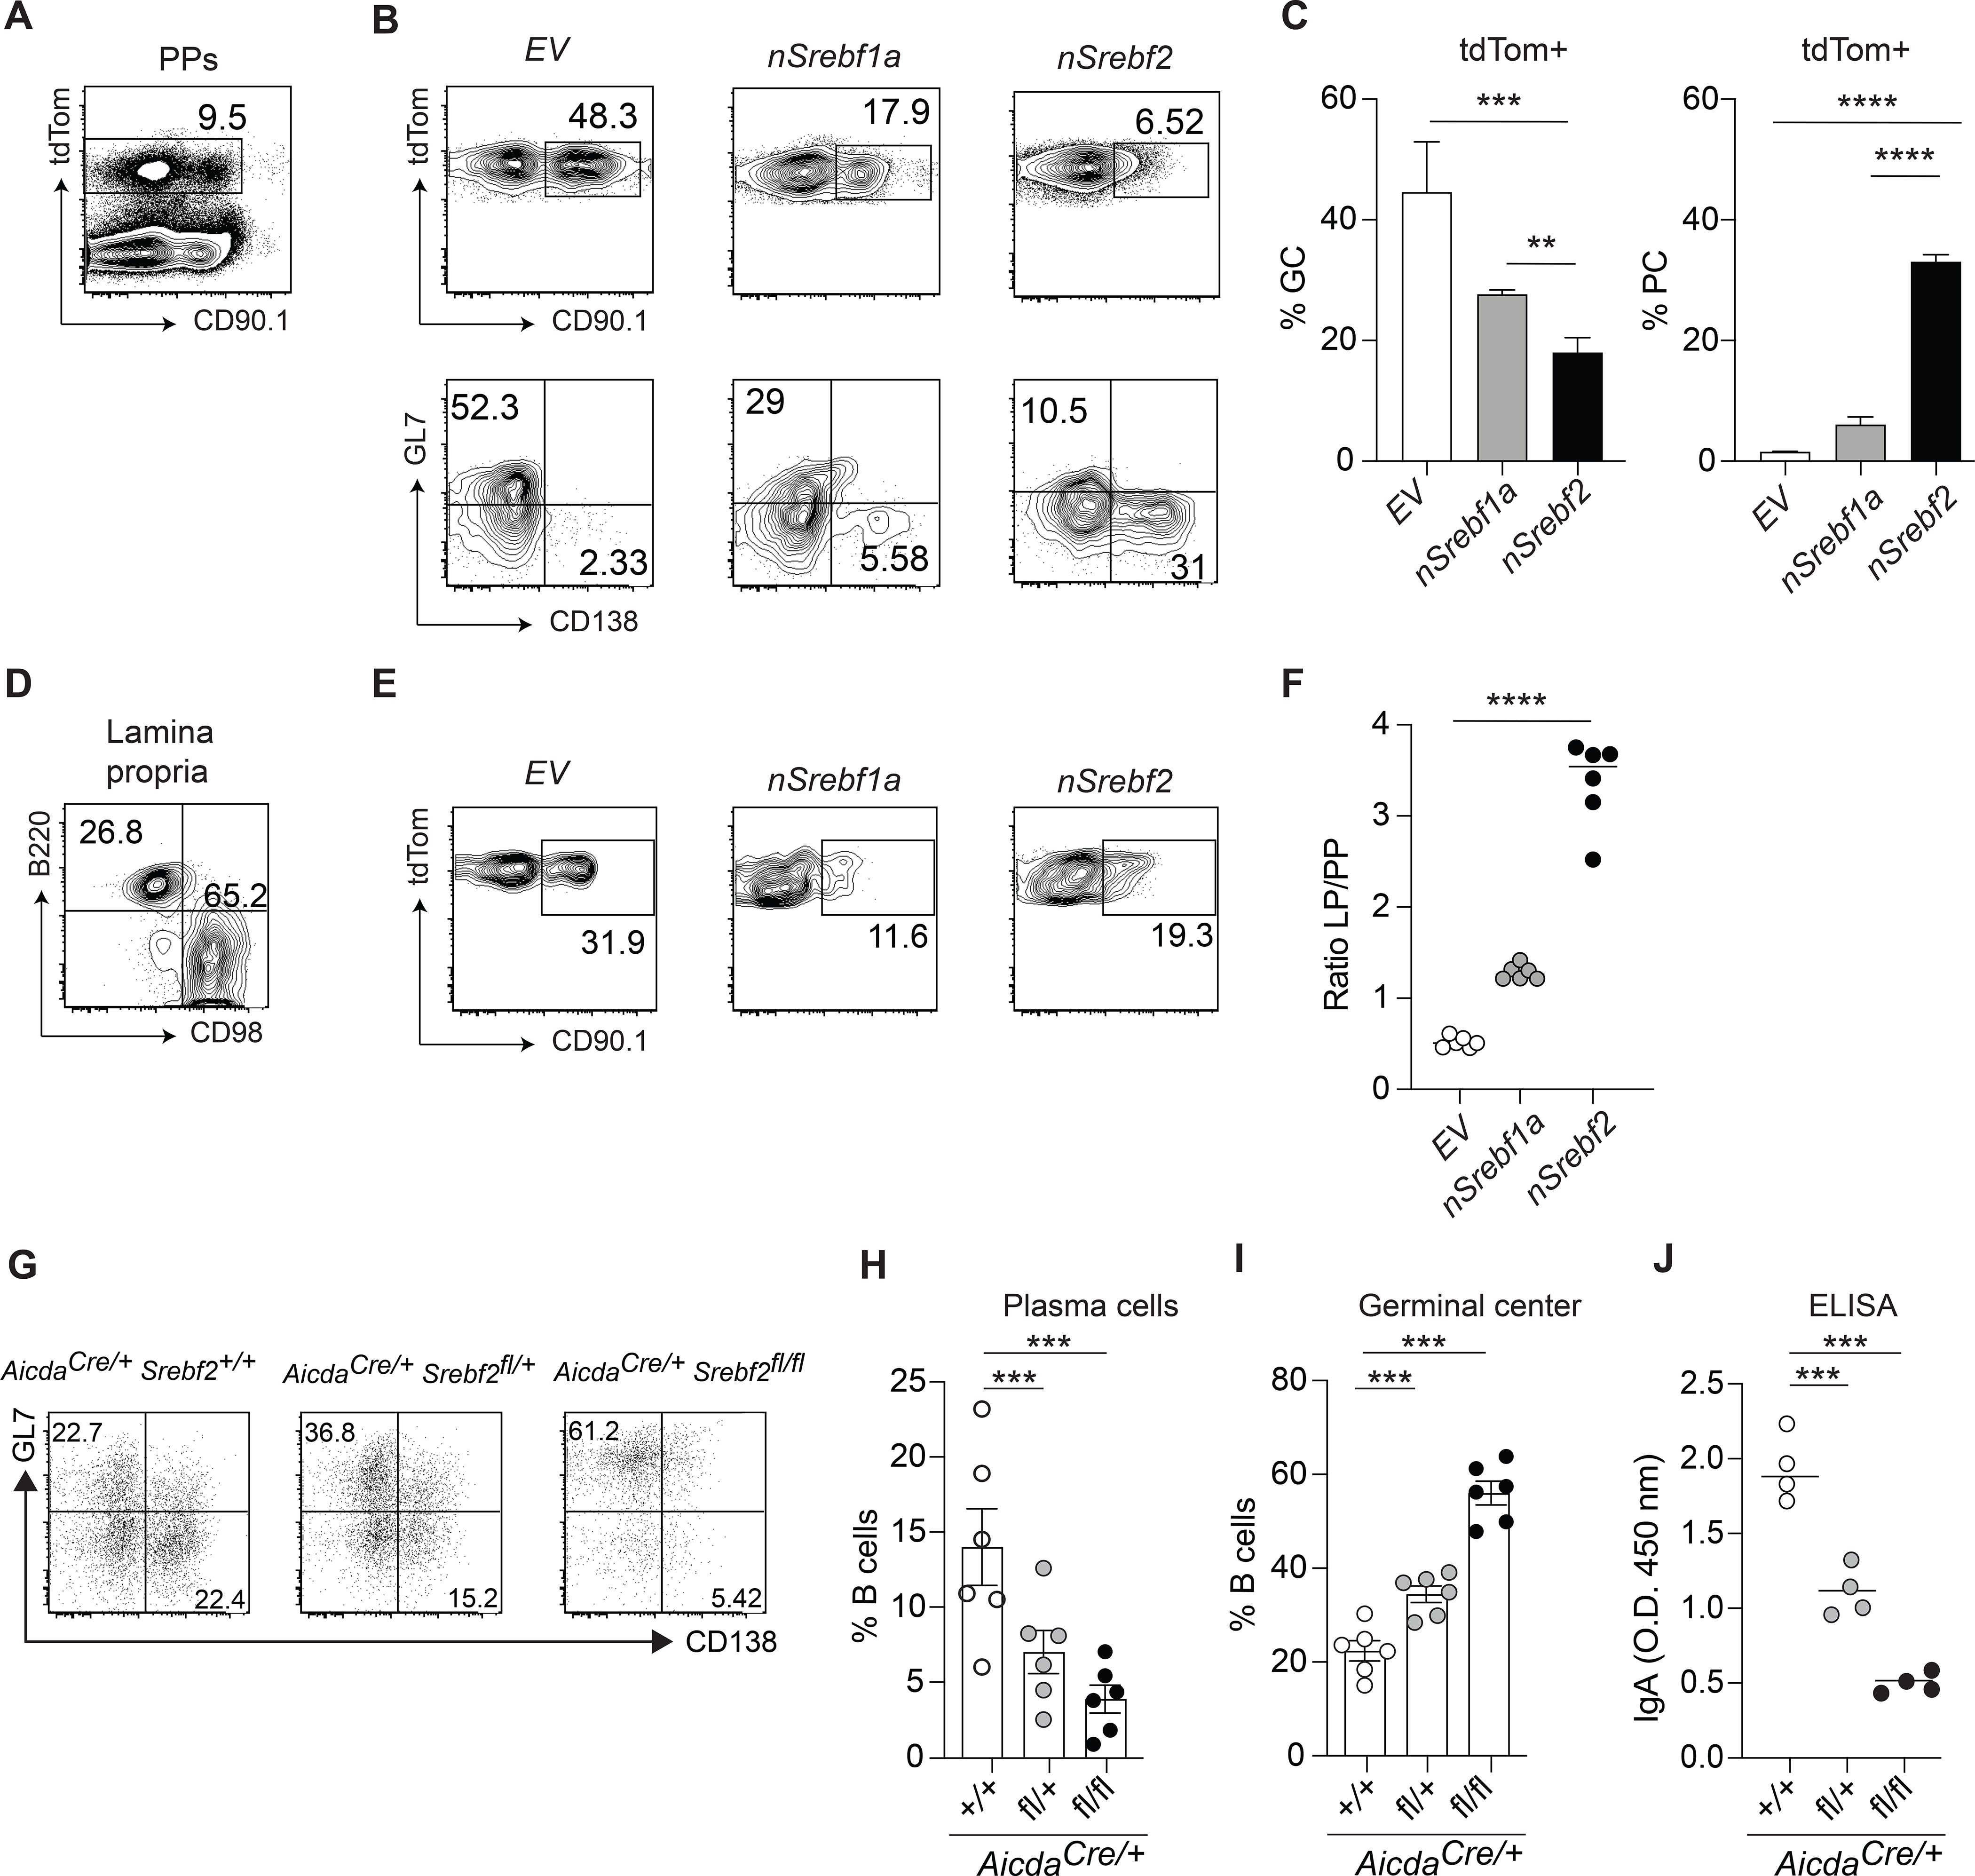
Figure 5. SREBP2 ectopic expression induces plasma cell development.

(A) Representative plot of AicdaCre/+Rosa26 tdTom/+ BM transduced with CD90.1 retroviral vector in Peyer’s patches.
(B) Representative plot of frequency and fate of tdTom+ B cells transduced with indicated vectors. (C) Summary of the data in (B). (D) Representative gating of tdTom+ PCs in lamina propria. (E) Representative plot of frequency and fate of tdTom+ B cells transduced with indicated vectors. (F) Ratio of transduced B cells in lamina propria and Peyer’s patches from data in (B) and (E). (G) Representative flow cytometry of GC B cells from mice of the indicated genotype cultured with NB21 cells for 2.5 days. (H,I) Frequency of PCs and GC B cell from G. (J) Quantification of secreted total IgA in A by ELISA. Data represents 3 independent experiments. Graphs show mean and SEM.**p<0.01,***p<0.005, ****p<0.001(two-way ANOVA).
