
FIGURE 2.
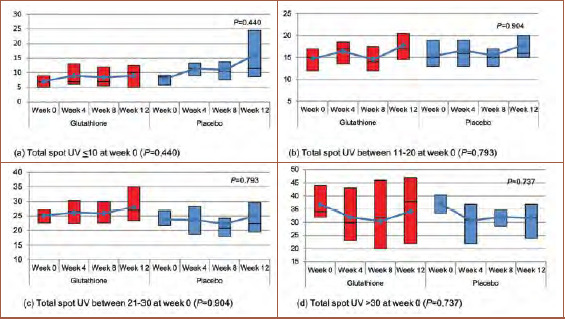
Transformation of total spot UV at Weeks 0, 4, 8, and 12; A) Total spot UV of 10 or less at Week 0 (p=0.440); B) total spot UV of 11 to 20 at Week 0 (p=0.793); C) total spot UV of 21 to 30 at Week 0 (p=0.904), and; D) total spot UV of greater than 30 at Week 0 (p=0.737).