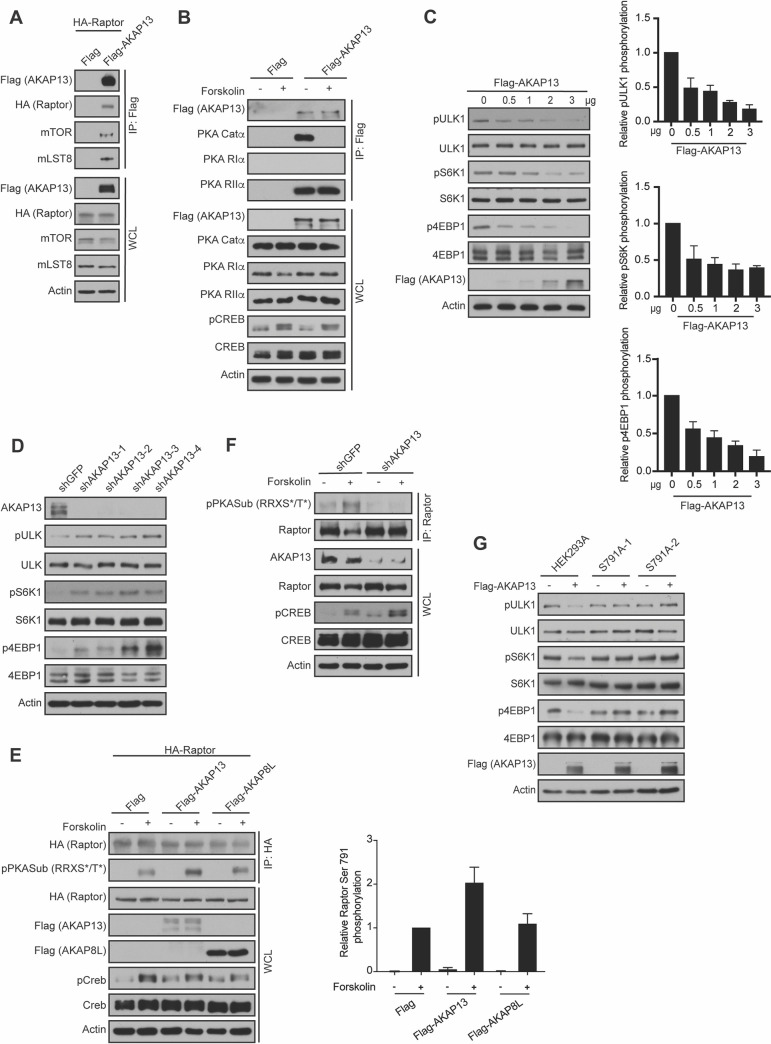
Fig 1. AKAP13 binds to and regulates mTORC1 activity.
(A) AKAP13 interacts with mTORC1. Empty vector (Flag) or Flag-tagged AKAP13 was co-expressed with HA-tagged Raptor in HEK293A cells. 24 hours later Flag immunoprecipitates (IPs) were analyzed by immunoblotting for Flag-tagged AKAP13, HA-tagged Raptor, mTOR, and mLST8. Actin was used as a loading control. WCL denotes whole cell lysate. (B) AKAP13 interacts with PKA Catα and PKA RIIα. Empty vector (Flag) or Flag-tagged AKAP13 was co-expressed with HA-tagged Raptor in HEK293A cells. 24 hours later cells were then treated with or without 10 μM forskolin and 200 μM IBMX for 1 h, and Flag immunoprecipitates (IPs) were analyzed by immunoblotting for Flag-tagged AKAP13, PKA Catα, PKA RIα, and PKA RIIα. CREB phosphorylation (pCREB) at Ser 133 was used as a positive control for forskolin stimulation. Actin and CREB were used as loading controls. WCL denotes whole cell lysate. (C) Left- Elevated AKAP13 levels decrease mTORC1 activity. Flag-tagged AKAP13 (0–3 μg) was overexpressed in HEK293A cells for 24 hours. mTORC1 activity was analyzed by protein immunoblotting for the phosphorylation status of S6K1 (pS6K1) at Thr 389, 4EBP1 (p4EBP1) at Thr 37 and Thr 46, and ULK1 (pULK1) at Ser 758. S6K, 4EBP1, ULK1, and Actin were probed as loading controls. Right- Quantification of phospho-ULK1. P-Values: 0 μg FLAG-tagged AKAP13 vs 0.5 μg FLAG-tagged AKAP13 p<0.05, 0 μg FLAG-tagged AKAP13 vs 1 μg FLAG-tagged AKAP13 p<0.01, 0 μg FLAG-tagged AKAP13 vs 2 μg FLAG-tagged AKAP13 p<0.0001 and 0 μg FLAG-tagged AKAP13 vs 3 μg FLAG-tagged AKAP13 p<0.001. Quantification of phospho-S6K. P-values: 0 μg FLAG-tagged AKAP13 vs 0.5 μg FLAG-tagged AKAP13 p = 0.05, 0 μg FLAG-tagged AKAP13 vs 1 μg FLAG-tagged AKAP13 p<0.01, 0 μg FLAG-tagged AKAP13 vs 2 μg FLAG-tagged AKAP13 p< 0.01 and 0 μg FLAG-tagged AKAP13 vs 3 μg FLAG-tagged AKAP13 p<0.0001. Quantification of phospho-4EBP1. P-values: 0 μg FLAG-tagged AKAP13 vs 0.5 μg FLAG-tagged AKAP13 p<0.05, 0 μg FLAG-tagged AKAP13 vs 1 μg FLAG-tagged AKAP13 p<0.01, 0 μg FLAG-tagged AKAP13 vs 2 μg FLAG-tagged AKAP13 p<0.001 and 0 μg FLAG-tagged AKAP13 vs 3 μg FLAG-tagged AKAP13 p<0.001. (D) Decreased AKAP13 levels increase mTORC1 activity. HEK293A stable cell lines expressing control shRNA (shGFP) or four different shRNA targeting AKAP13 (shAKAP13 1–4) were generated. mTORC1 activity and loading controls were analyzed as described in (C). (E) Left- Elevated AKAP13 levels increase Raptor Ser 791 phosphorylation. HA-tagged Raptor was co-expressed with empty vector (Flag), Flag-tagged AKAP13, or Flag-tagged AKAP8L in HEK293A cells. 24 hours later cells were then treated with or without 10 μM forskolin and 200 μM IBMX for 1 hour, and HA immunoprecipitates (IPs) were analyzed by immunoblotting for HA-tagged Raptor, and phospho-PKA substrate antibody (pPKASub (RRXS*/T*)). CREB phosphorylation (pCREB) at Ser 133 was used as a positive control for forskolin stimulation. Actin and CREB were used as loading controls. WCL denotes whole cell lysate. Right- Quantification of phospho-PKA substrate (pPKASub (RRXS*/T*) to determine Raptor Ser 791 phosphorylation. P-values: Flag -Forskolin vs Flag +Forskolin p<0.0001, Flag-tagged AKAP13 -Forskolin vs Flag-tagged AKAP13 +Forskolin p<0.01, Flag-tagged AKAP8L -Forskolin vs Flag-tagged AKAP8L +Forskolin p<0.01, Flag +Forskolin vs Flag-tagged AKAP8L -Forskolin p<0.0001, Flag +Forskolin vs Flag-tagged AKAP13 +Forskolin p<0.05. (F) Decreased AKAP13 levels decrease Raptor Ser 791 phosphorylation. HEK293A stable cell lines expressing control shRNA (shGFP) or shRNA targeting AKAP13 (shAKAP13) were generated. HEK2943A cells were then treated with or without 10 μM forskolin and 200 μM IBMX for 1 hour, and Raptor immunoprecipitates (IPs) were analyzed by immunoblotting for Raptor and phospho-PKA substrate antibody (pPKASub (RRXS*/T*)). CREB phosphorylation (pCREB) at Ser 133 was used as a positive control for forskolin stimulation. Actin and CREB were used as loading controls. WCL denotes whole cell lysate. (G) Elevated AKAP13 inhibits mTORC1 though Raptor Ser 791 phosphorylation. Flag-tagged AKAP13 was overexpressed for 24 hours in HEK293A or HEK293A Raptor Ser 791 mutant cells (S791A-1, S791A-2). mTORC1 activity and loading controls were analyzed as described in (C).

