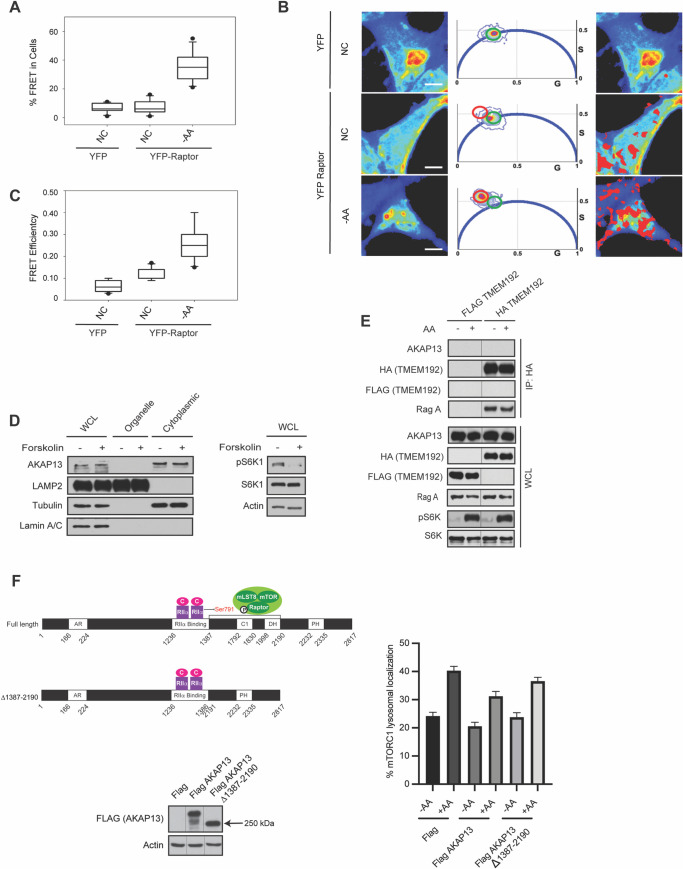
Fig 3. AKAP13 and mTORC1 interact under amino acid deficient conditions.
(A) AKAP13-Raptor interaction is increased in the absence of amino acids in human embryonic kidney 293 (HEK293A) cells. The binding between GFP-tagged AKAP13 and YFP-tagged Raptor was assessed under the different conditions: 1) Normal conditions (NC) containing amino acids; and 2) Amino acid deficient conditions (-AA) where the cells were starved of amino acids for 1 h. There was significant increase in AKAP13-Raptor interaction in amino acid deficient conditions when compared to normal conditions. P-values: GFP-tagged AKAP13 + Control (YFP) vs GFP-tagged AKAP13 + YFP-tagged Raptor -AA p<0.0001, GFP-tagged AKAP13 + YFP-tagged Raptor NC vs GFP-tagged AKAP13 +YFP-tagged Raptor -AA p<0.0001. (B) The first panel shows intensity images of HEK293A cells with GFP-tagged AKAP13 co-transfected with YFP (FRET control) or YFP-tagged Raptor (first panel). The middle panel shows the phasor distribution of 1) YFP with no FRET (Green circle) and 2) YFP with high FRET (red circle). The third panel shows spatial distribution of pixels associated FRET highlighting the differences in FRET under different conditions. (C) Box plots showing FRET efficiency of HEK293A cells co-transfected with GFP-tagged AKAP13 and YFP-tagged Raptor under the different conditions described in (A). There was significant increase in AKAP13-Raptor FRET efficiency in amino acid deficient conditions when compared to normal conditions, indicating that AKAP13 and Raptor are closer in proximity under these conditions. P-values: GFP-tagged AKAP13 + Control (YFP) vs GFP-tagged AKAP13 + YFP-tagged Raptor NC p<0.001, GFP-tagged AKAP13 + Control (YFP) vs GFP-tagged AKAP13 + YFP-tagged Raptor -AA p<0.0001, GFP-tagged AKAP13 + YFP-tagged Raptor NC vs GFP-tagged AKAP13 + YFP-tagged Raptor -AA p<0.0001. (D) AKAP13 resides in the cytoplasm. Left—Subcellular fractionation experiments in HEK293A cells were performed separating the organelle and cytoplasmic fraction. AKAP13, LAMP2 (lysosomal marker), Tubulin (cytoplasmic marker), and Lamin A/C (nuclear marker) were immunoblotted. Right–mTORC1 activity was analyzed by protein immunoblotting for the phosphorylation status of S6K1 (pS6K1) at Thr 389. Actin were probed as loading control. (E) AKAP13 does not localize to the lysosome. MIA Paca-2 cells stably expressing Flag-tagged or HA-tagged TMEM192 were starved of amino acids (-AA) for 2 hours, and then stimulated with amino acids (+AA) for 2 hours. HA-tagged TMEM192 was immunoprecipitated with HA beads and IP and WCL were probed for AKAP13, HA or RagA. Flag, pS6K and S6K were probed for as controls. (F) Left–HEK293A cells were transfected with Flag, wild-type Flag-tagged AKAP13, and Flag-tagged AKAP13 Δ1387–2190 constructs. Right–After 24 hours, cells were starved of amino acids for 2 hours, and then stimulated with amino acids for 1 hour. mTOR and LAMP2 (lysosomal marker) co-localization was quantified. P-values: Flag -AA vs Flag +AA p<0.0001, Flag +AA vs Flag-tagged AKAP13 +AA p<0.001, Flag-tagged AKAP13 -AA vs Flag-tagged AKAP13 +AA p<0.0001, Flag-tagged AKAP13 Δ1387–2190 -AA vs Flag-tagged AKAP13 Δ 1387–2190 +AA p<0.0001.

