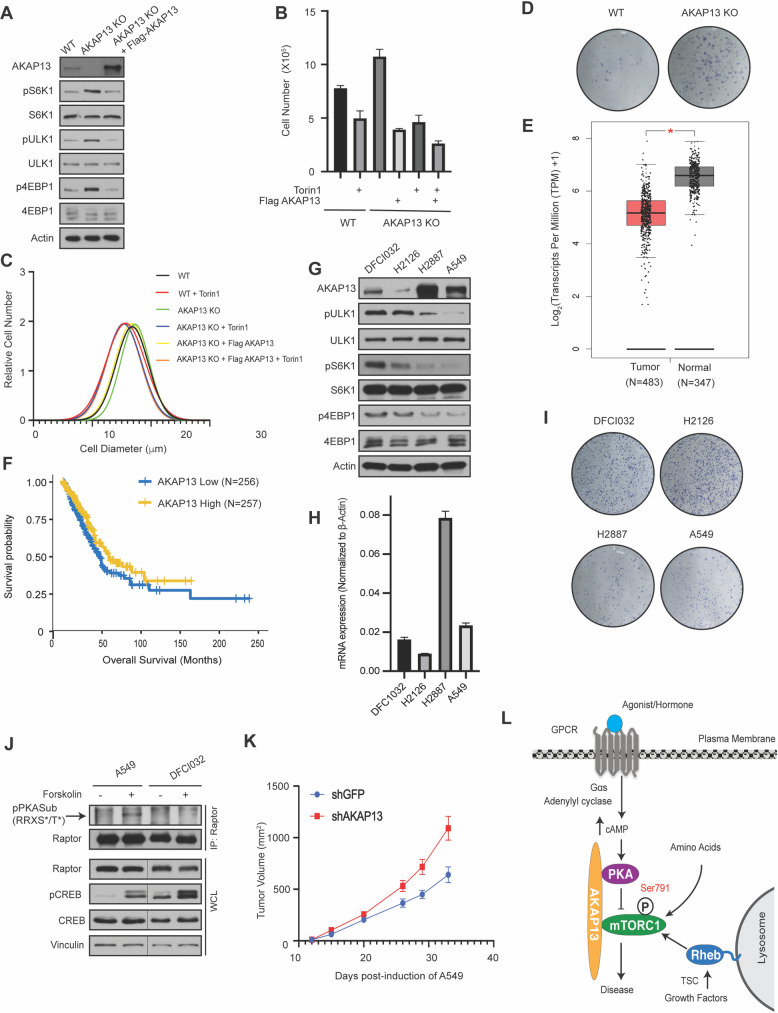
Fig 4. AKAP13 regulates mTORC1 mediated biology and lung cancer tumorigenesis.
(A) The level of AKAP13 regulates mTORC1 activity. Wild-type (WT), AKAP13 knock-out (KO), or AKAP13 KO expressing Flag-tagged AKAP13 human embryonic kidney 293 (HEK293A) cells were assessed. mTORC1 activity was analyzed by protein immunoblotting for the phosphorylation status of S6K1 (pS6K1) at Thr 389, 4EBP1 (p4EBP1) at Thr 37 and Thr 46, and ULK1 (pULK1) at Ser 758. S6K, 4EBP1, ULK1, and Actin were probed as loading controls. (B) The level of AKAP13 regulates cell proliferation. Proliferation in wild-type (WT), AKAP13 knock-out (KO), or AKAP13 KO expressing Flag-tagged AKAP13 HEK293A cells with or without Torin1 was analyzed. P- values: WT -Torin1 vs WT +Torin1 p<0.05, WT -Torin1 vs AKAP13 KO -Torin1 p<0.05, WT -Torin1 vs AKAP13 KO + Flag-tagged AKAP13 -Torin1 p<0.001, AKAP13 KO -Torin1 vs AKAP13 KO +Torin1 p<0.01, AKAP13 KO + Flag-tagged AKAP13 -Torin1 vs AKAP13 KO + Flag-tagged AKAP13 +Torin1 p<0.01, WT +Torin1 vs AKAP13 KO +Flag-tagged AKAP13 +Torin1 p<0.05, AKAP13 KO -Torin1 vs AKAP13 KO + Flag-tagged AKAP13 -Torin1 p<0.001. (C) The level of AKAP13 regulates cell size. Cell size in wild-type (WT), AKAP13 knock-out (KO), or AKAP13 KO expressing Flag-tagged AKAP13 HEK293A cells treated with or without Torin1 was analyzed. P-values: WT -Torin1 vs WT +Torin1 p<0.001, WT -Torin1 vs AKAP13 KO -Torin1 p<0.01, AKAP13 KO -Torin1 vs AKAP13 KO +Torin1 p<0.0001, AKAP13 KO + Flag-tagged AKAP13 -Torin1 vs AKAP13 KO + Flag-tagged AKAP13 +Torin1 p<0.001, WT +Torin1 vs AKAP13 KO +Torin1 p<0.05, AKAP13 KO -Torin1 vs AKAP13 KO + Flag-tagged AKAP13 -Torin1 p<0.0001. (D) The level of AKAP13 regulates colony formation. Colony formation experiments in wild-type (WT) and AKAP13 knock-out (KO) HEK293A cells was analyzed. (E) AKAP13 levels are downregulated in lung adenocarcinoma (LUAD). Data was derived from GEPIA database (http://gepia.cancer-pku.cn). (F) AKAP13 levels correlate with LUAD overall survival. A TCGA cohort of LUAD was divided into two groups according to the mRNA expression levels of AKAP13. Overall survival was compared between these two groups, as shown in Kaplan-Meier curves. Numbers of patients in each group, log-rank P values, and hazard ratios (H) with 95% confidence interval (CI) are indicated. p = 0.037. (G) AKAP13 levels correlate with mTORC1 activity in LUAD cell lines. AKAP13 proteins levels and mTORC1 activity were assessed in LUAD cell lines (DFCI032, H2126, H2887 and A549). mTORC1 activity and controls were analyzed as in (A). (H) AKAP13 mRNA expression level parallels protein expression level in LUAD cell lines DFC1032, H2125, H2887, and A549. The quantitative mRNA expression (2-ΔΔCT) in LUAD cells were determined by real-time quantitative PCR. P-values: DFC1032 cells vs. H2126 cells p<0.001, DFC1032 cells vs. H2887 cells p<0.0001, DFC1032 cells vs. A549 cells p<0.01, H2126 cells vs. H2887 cells p<0.0001, H2887 cells vs. A549 cells p<0.0001, H2126 cells vs. A549 p<0.0001. (I) AKAP13 levels correlate with colony formation in LUAD cell lines. Colony formation experiments in LUAD cell lines (DFCI032, H2126, H2887 and A549) was analyzed. (J) Cells with higher AKAP13 levels have an increase in Raptor Ser 791 phosphorylation. A549 or DFC1032 cells were treated with or without 10 μM forskolin and 200 μM IBMX, and Raptor was immunoprecipitated (IP) analyzed by immunoblotting with a PKA substrate antibody that recognizes RRXS*/T* (pPKA Sub (RRXS*/T*)). CREB phosphorylation was included as a positive control for forskolin stimulation. CREB, Raptor, and Vinculin are controls. WCL denotes whole cell lysate. (K) Decreased levels of AKAP13 increases tumor volume. Subcutaneous xenografts were performed on NOD SCID mice using stable A549 cell lines expressing control shRNA (shGFP) or shRNA targeting AKAP13 (shAKAP13). P-values: Day 15 shGFP vs shAKAP13 p<0.05, Day 26 shGFP vs shAKAP13 p<0.05, Day 29 shGFP vs shAKAP13 p<0.05, Day 33 shGFP vs shAKAP13 p<0.05. (L) Working model of how GPCR signaling inhibits mTORC1. Increased cAMP levels activate PKA to phosphorylate Raptor at Ser 791 resulting in mTORC1 inhibition. AKAP13 scaffolds mTORC1 next to the PKA holoenzyme in the cytoplasm.

