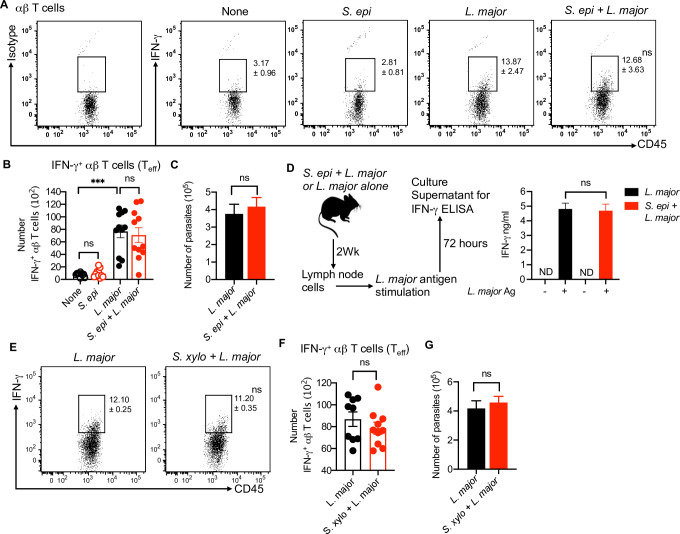
Fig 3. S. epidermidis and S. xylosus colonization does not impact the type 1 immune response.
(A) Percent of IFN-γ- producing αβ T cells in the skin of different treatment groups at week two. (B) Number of IFN-γ- producing αβ T cells in the skin of different treatment groups at week two. (C) L. major parasite load in different treatment groups at week two. (D) L. major antigen specific IFN-γ level in cultured supernatant of lymph node cells in different treatment groups. Cells were prepared from mice at week two. (E) Percent of IFN-γ-producing αβ T cells in the skin of different treatment groups at week two. (F) Number of IFN-γ- producing αβ T cells in the skin of different treatment groups at week two. (G) L. major parasite load in different treatment groups at week two. Number within the flow plot show percent of IFN-γ+ cells with SEM (A,E). Data are from three (A,B) or two (C,D,E,F,G) experiments with a total of five to 12 mice in each group. Statistical comparison within the flow plot is with the L. major group. Error bars shows SEM. Two-tailed unpaired Student’s t-test with Welch’s correction or one-way ANOVA with Tukey’s multiple comparison analysis (B). ND, not detected; ns, not significant; ***p<0.001.

