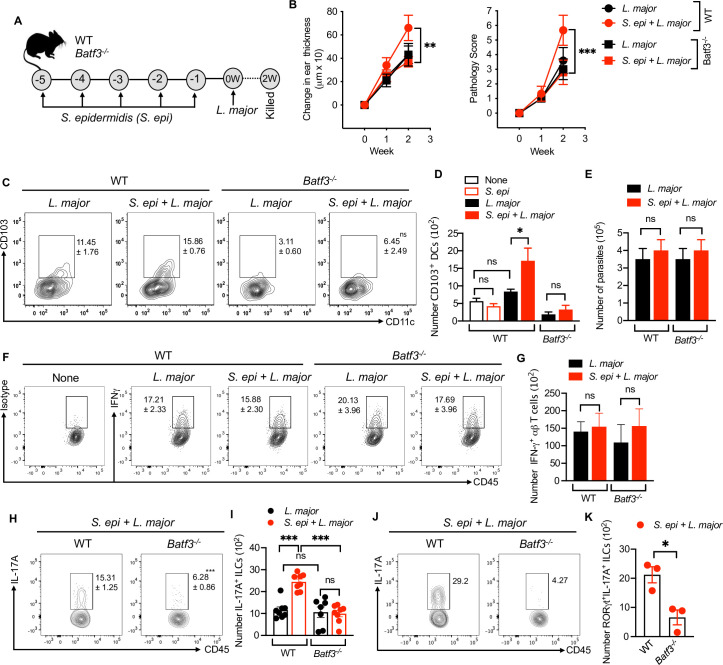
Fig 4. S. epidermidis dependent IL-17A+ILCs and inflammatory responses require CD103+ DCs.
(A) Schematic representation of S. epi and L. major treatment protocol in WT and Batf3-/- mice. (B) Ear thickness measurement and pathology score in WT and Batf3-/- mice colonized with S. epi or uncolonized prior to L. major infection at week one and two. (C,D) Percent and number of CD103+ DCs at week two in WT and Batf3-/- mice colonized with S. epi or uncolonized prior to L. major infection at week two. (E) L. major parasite load in WT and Batf3-/- mice colonized with S. epi or uncolonized prior to L. major infection at week two. (F,G) Percent and number of IFN-γ+αβ T cells in WT and Batf3-/- mice colonized with S. epi or uncolonized prior to L. major infection at week two. (H,I) Percent and number of IL-17A+ILCs in WT and Batf3-/- mice colonized with S. epi or uncolonized prior to L. major infection at week two. (J,K) Percent and number of RORγt+IL-17A+ILCs in the skin of S. epi colonized and L. major infected WT and Batf3-/- mice at week two. Number within the flow plot show percent of CD103+CD11c+ (C), IFN-γ+ (F) and IL-17A+ (H,J) cells with SEM. Data are from two experiments with a total of six to eight mice in each group (C,D,F,G,H,I) or from one experiment representative of two with five mice in each group (B,E). Statistical comparison with in the flow plot in C is with L. major group of Batf3-/- mice. Error bars shows SEM (D,E,G,I,J,K) or SD (B). Two-tailed unpaired Student’s t-test with Welch’s correction or one-way ANOVA with Tukey’s multiple comparison analysis (D,I). ns, not significant; *p<0.05, **p<0.01, ***p<0.001.

