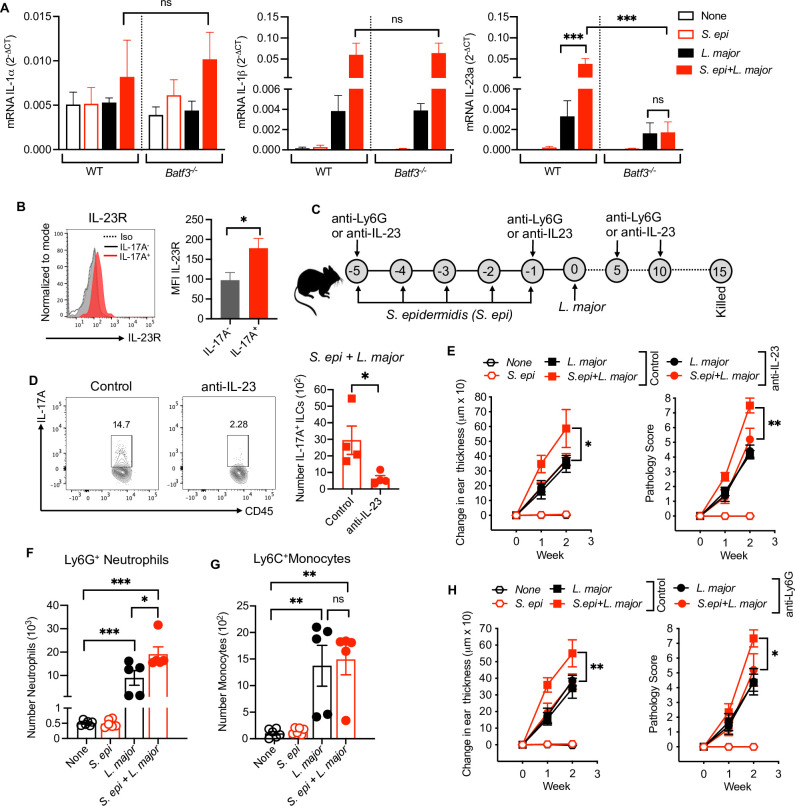
Fig 5. S. epidermidis dependent IL-17A+ILCs require IL-23.
(A) qRT-PCR analysis of IL-1α, IL-1β and IL-23a in WT and Batf3-/- mice in different treatment groups at week two. (B) IL-23R expression on IL-17A+ and IL-17A-ILCs in S. epi colonized and L. major infected mice at week two. (C) Schematic representation of anti-IL-23 and anti-Ly6G treatment protocol in S. epi colonized and L. major infected WT mice. (D) IL-17A production from ILCs in control (IgG) and anti-IL-23 treated in S. epi colonized and L. major infected at week two. (E) Ear thickness measurement and pathology score in IgG and anti-IL-23 treated L. major and in S. epi colonized and L. major infected mice at week one and two. (F,G) Number of neutrophils and monocytes in different treatment groups at week two. (H) Ear thickness measurement and pathology score in IgG and anti-Ly6G treated L. major and in S. epi colonized and L. major infected mice at week one and two. Number within the flow plot show percent of IL-17A+ cells within the gated box. Data are from one experiment with a total of three to five mice in each group (A,B,D,E,F,G,H) Error bars show SEM (A,D,F) or SD (E,H). Two-tailed unpaired Student’s t-test with Welch’s correction or one-way ANOVA with Tukey’s multiple comparison analysis (A,F,G). ns, not significant; *p<0.05, **p<0.01, ***p<0.001.

