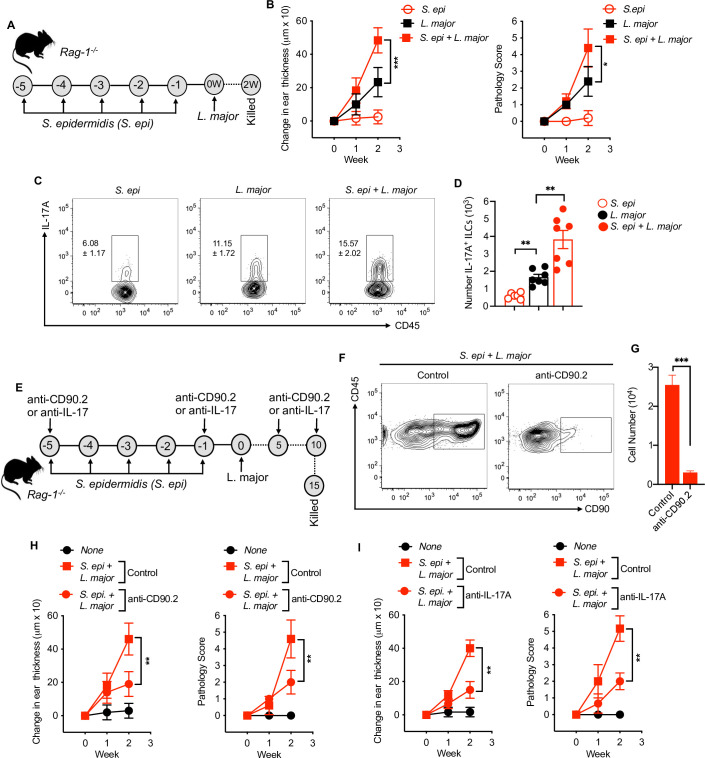
Fig 6. IL-17A+ILCs are sufficient to drive S. epidermidis mediated inflammation.
(A) Schematic representation of S. epi and L. major treatment protocol in Rag1-/- mice. (B) Ear thickness measurement and pathology score in Rag1-/- mice colonized with S. epi or uncolonized prior to L. major infection at week one and two. (C,D) Percent and number of IL-17A- producing ILCs at week two in Rag1-/- mice colonized with S. epi or uncolonized prior to L. major infection. (E) Schematic representation of ILC depletion or IL-17 neutralization treatment protocol in Rag1-/- mice. (F) Representative flow cytometry plot of ILC depletion as identified as CD45+CD90+ cells in Rag1-/- mice. (G) Number of CD90+ cells in control and anti-CD90.2 treated mice. (H) Ear thickness measurement and pathology score in Rag1-/- mice with and without (Control; IgG) ILC depletion in different groups. (I) Ear thickness measurement and pathology score in Rag1-/- mice with and without (Control; IgG) IL-17A neutralization by anti-IL-17A antibody in different groups. Number within the flow plot show percent of IL-17A+ cells with SEM (C). Data are from two experiments with a total of six to seven mice in each group. Statistical comparison within the flow plot is with L. major group. Error bars shows SEM (D,G) or SD (B,H,I). Two-tailed unpaired Student’s t-test with Welch’s correction. *p<0.05, **p<0.01, ***p<0.001.

