
Figure 3. Sequencing the 5’ ends of capped RNA shows increased cryptic transcription during hMSC aging.
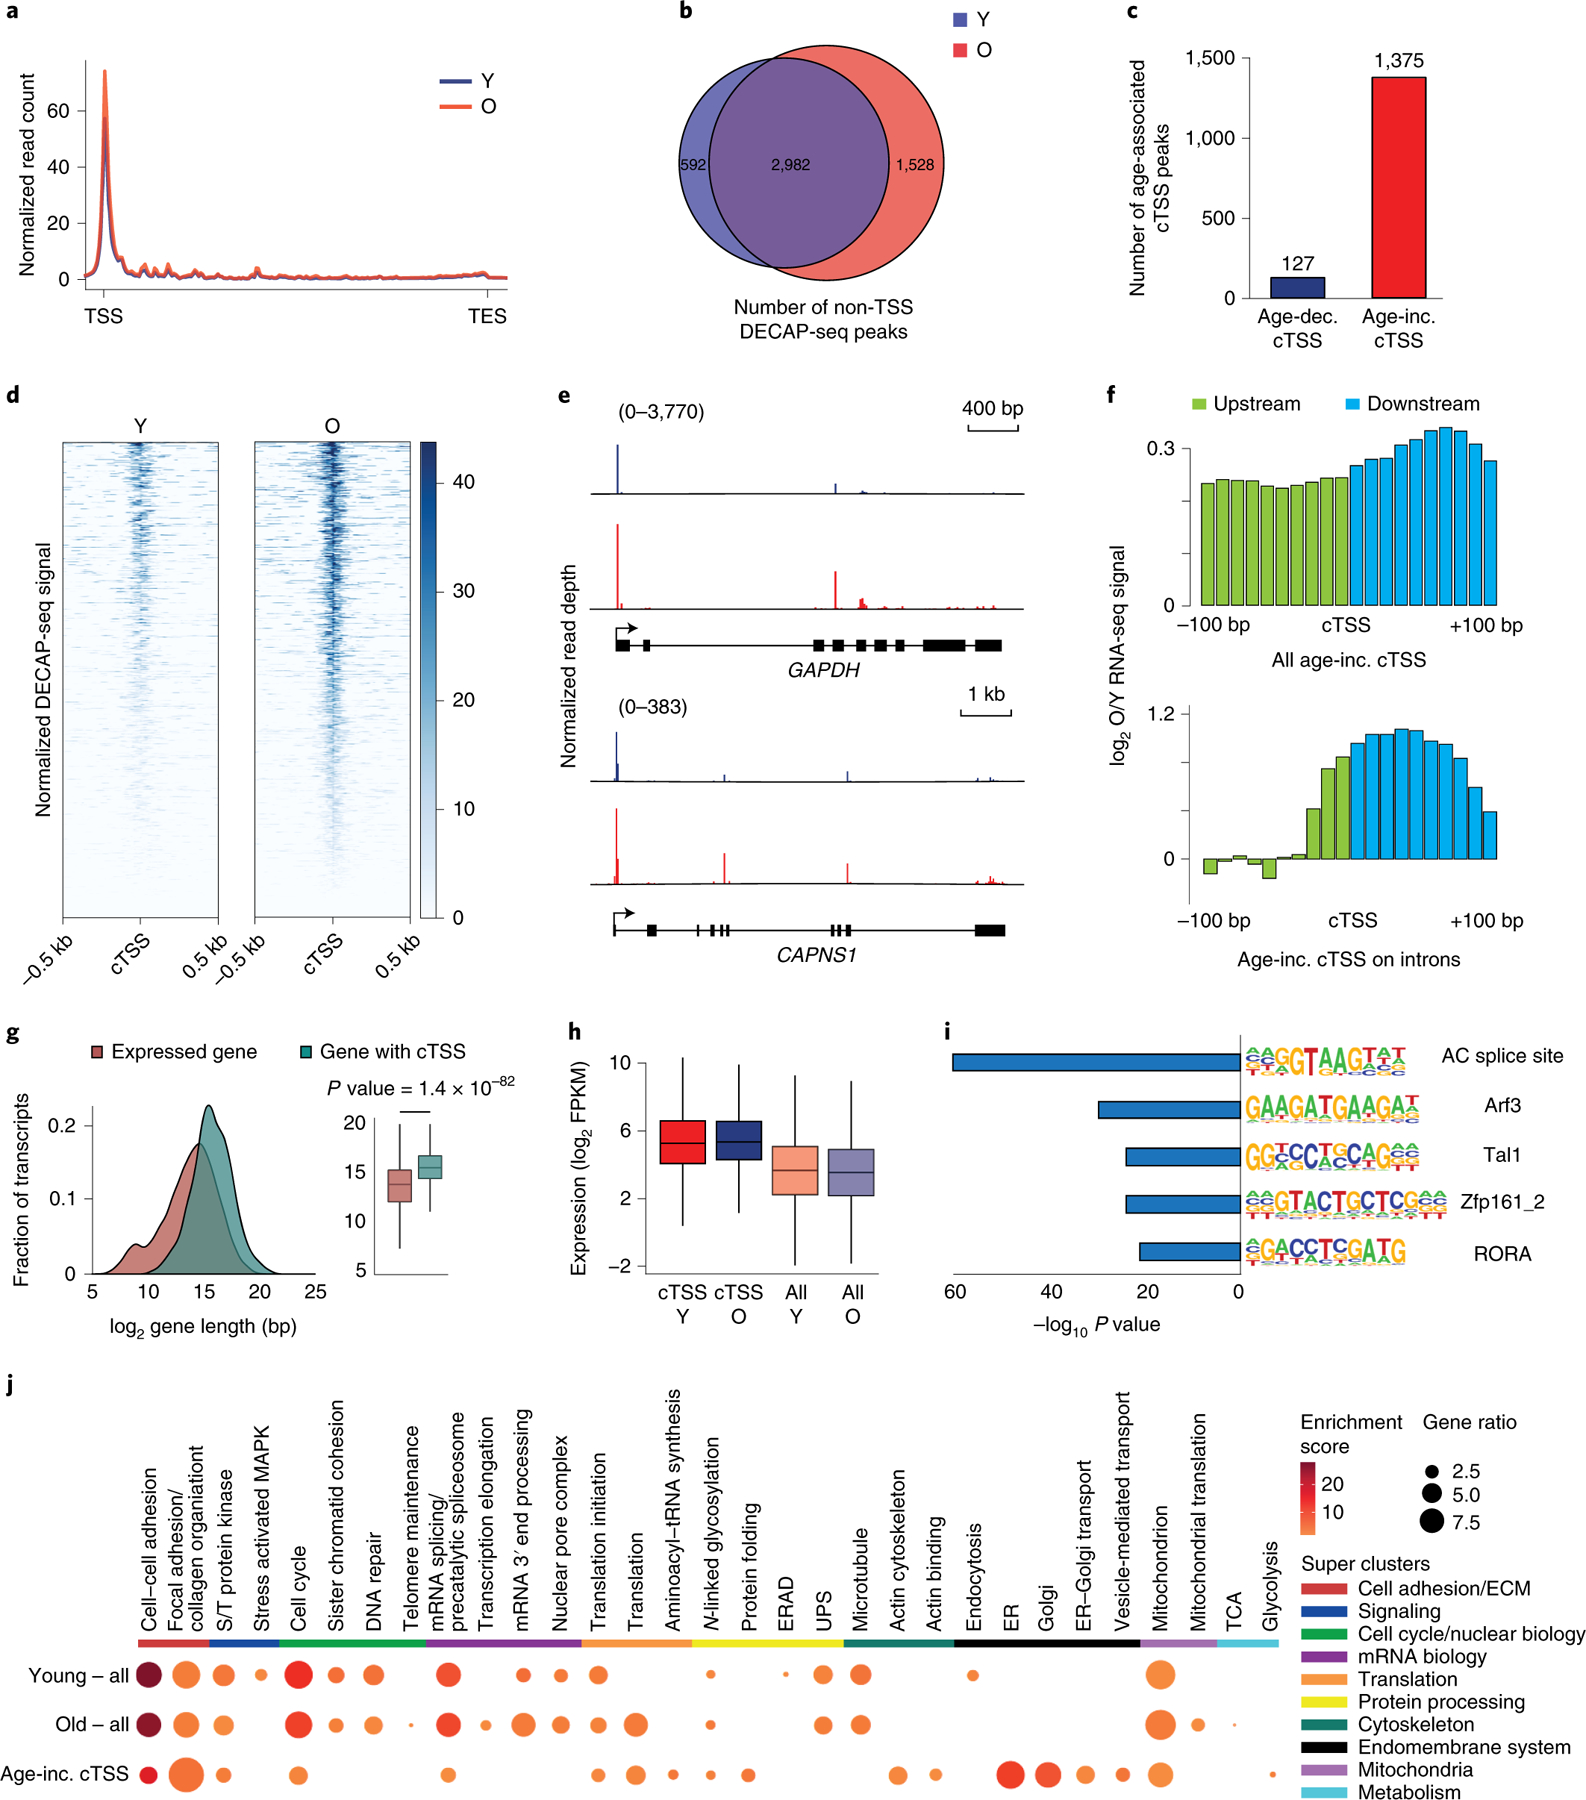
A) Metagene plot showing the distribution of normalized DECAP-seq reads along expressed genes. Young sample in blue; old in red. B) Venn diagram showing the overlap of DECAP-seq peaks (cTSSes) in young and old samples. C) Bar chart indicating the number of DECAP-seq peaks with significantly increased reads in young (blue, age-dec. cTSS) and old (red, age-inc. cTSS) samples. The latter group are as age-associated cTSSes. D) Read pile up of DECAP-seq signal surrounding age-associated cTSSes; young sample on the left and old on the right. E) Mapped DECAP-seq reads from young samples (top, blue) and old samples (bottom, red) along the GAPDH and CAPAS1 genes, which have age-associated cryptic transcription. F) Log2-transformed old to young ratio of averaged normalized RNA-seq reads mapping to the 200bp interval surrounding age-associated cTSSes. All sites are shown in the top plot; only those sites located in introns are shown in the bottom. The region upstream of the age-increased cTSS is green; downstream is blue. G) Length distribution of genes that undergo age-associated cryptic transcription (n=873, blue) and all genes (n=14062, red). p-values were calculated by a two-sided Wilcoxon signed-rank test with the null hypothesis that the average length is the same. H) Boxplot of the log2-transformed FPKM of genes that undergo age-associated cryptic transcription (n=873) compared to all expressed genes (n=13148). Genes with FPKM < 1 were filtered. I) HOMER analysis of the DNA sequence ±200bp from the identified age-associated cTSSes showing known motifs with significant p-values. J) Heatmap showing the results of DAVID GO cluster enrichment of genes containing DECAP-seq peaks in young hMSCs, old hMSCs, and those that increase with age. For boxplots, bounds of box show the 25th and 75th percentiles; the central lines in the box plots represent the median value; and whiskers show 1.5-fold of the interquartile range. S/T protein kinase: serine/threonine protein kinase; ERAD: endoplasmic reticulum-associated degradation; ER: endoplasmic reticulum; UPS: ubiquitin-proteasome system. In all panels, Y: young; O: old, TSS: transcription start site; cTSS: cryptic transcription start site.