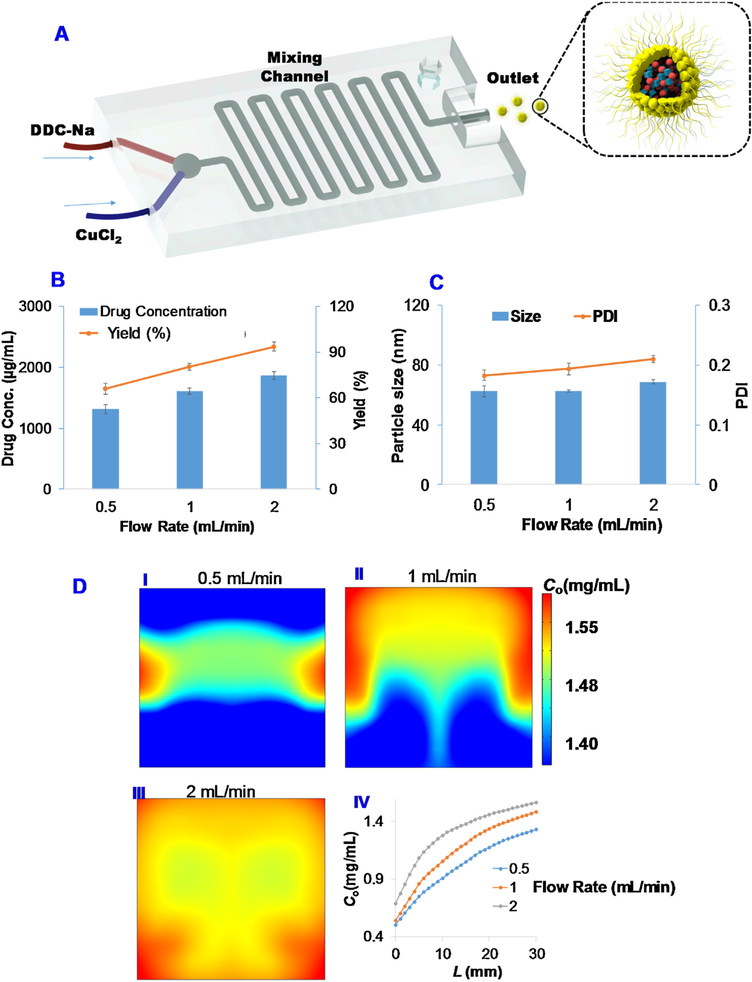
Fig. 3. Production of BSA Cu(DDC)2 MONs with a microfluidic device.
(A) Schematic illustration to show the preparation of BSA Cu(DDC)2 MONs. The effects of flow rate on (B) drug concentration and yield, and (C) particle size and PDI. (D) Computational modeling to simulate the effect of flow rate on the MON formation. Cu(DDC)2 concentration C0 surface plot on the outlet cut cross plane for different flow rate (I) 0.5 mL/min, (II) 1 mL/min, and (III) 2 mL/min, respectively. (IV) The simulated Cu(DDC)2 concentration C0 versus the distance from mixing start point.

