
Figure 1.
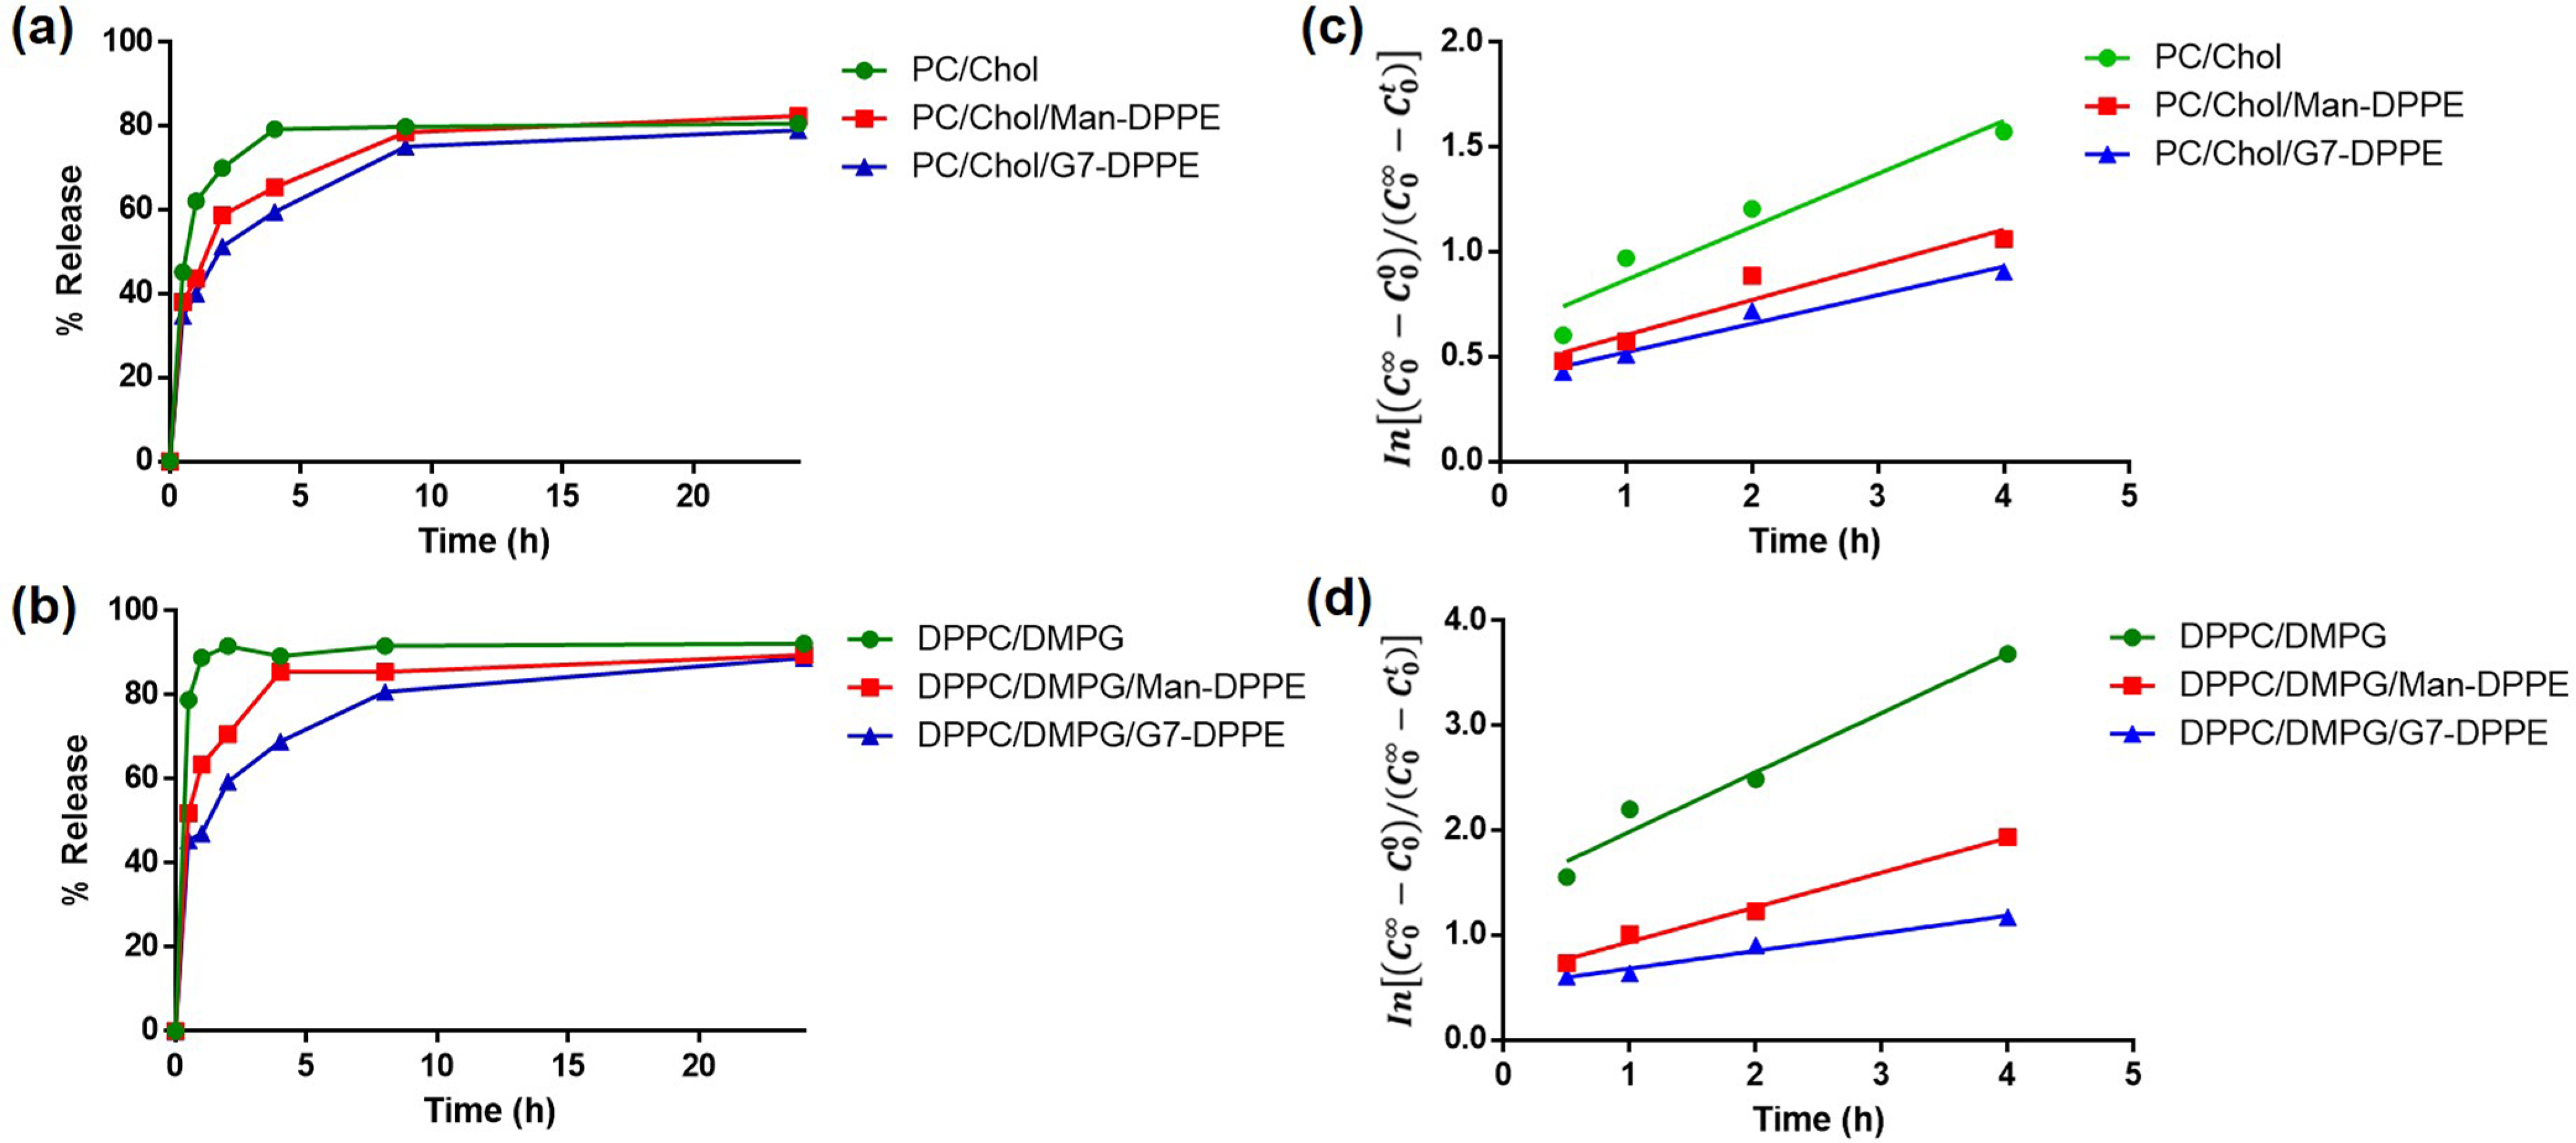
(a, b) Time course of rifampicin release from nonfluid (a) and fluid liposomes (b). (c, d) Kinetics of drug release for rifampicin encapsulated in nonfluid (c) and fluid liposomes (d). Liposomes were dialyzed in Milli-Q water at 37 °C while shaking. Concentrations of rifampicin were measured by UV–vis spectroscopy against a standard calibration curve (Figure S1).