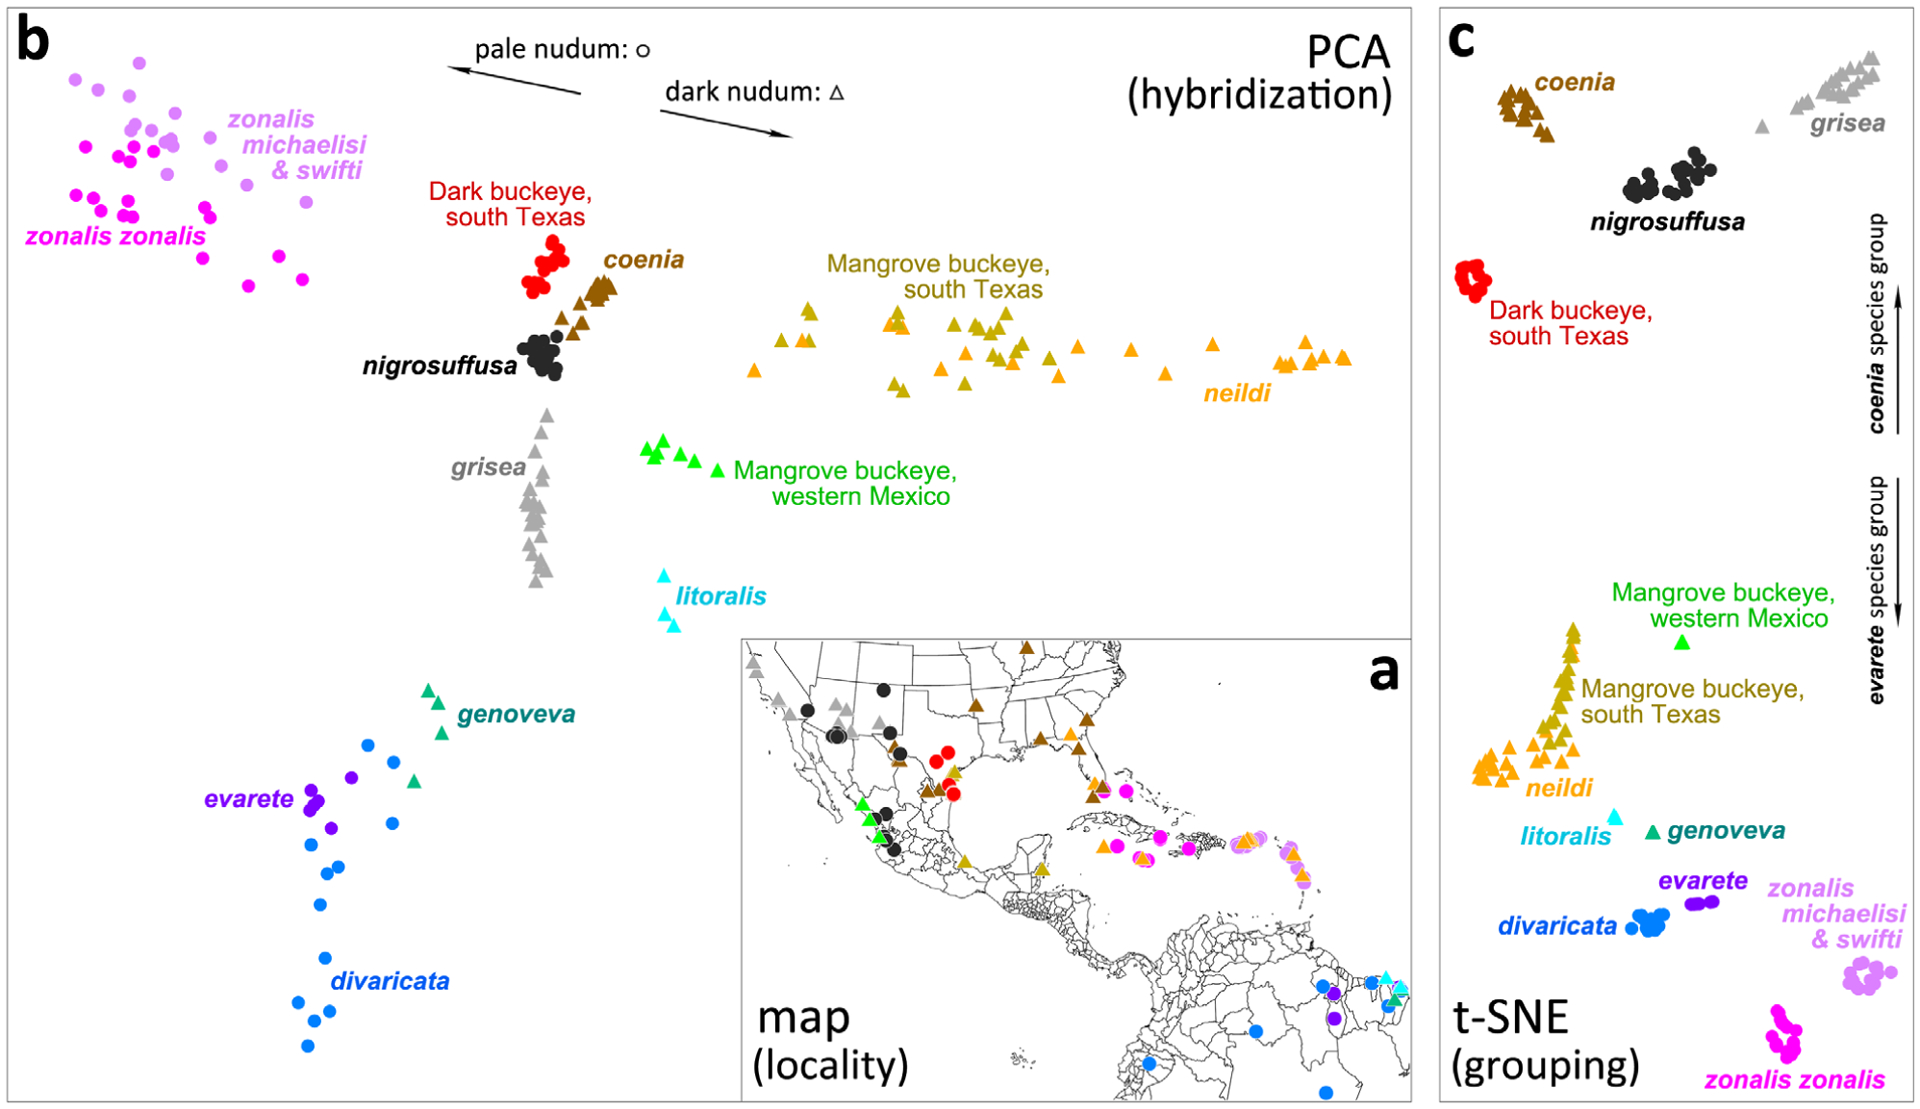
Fig. 6.

Clustering Junonia populations. (a) Map of localities of specimens used in the analysis; (b) principal component analysis (PCA) plot showing specimens as points in the plane of the second and fourth principal components; (c) t-sne clustering of specimens based on their PCA coordinates. Circles correspond to populations with pale nudum of the antennal club, and triangles denote populations with a dark nudum. Distinct taxa are coloured differently, and the colour scheme is the same for all three panels in the figure (as well as in Figs 16,17).
