Fig. 7.

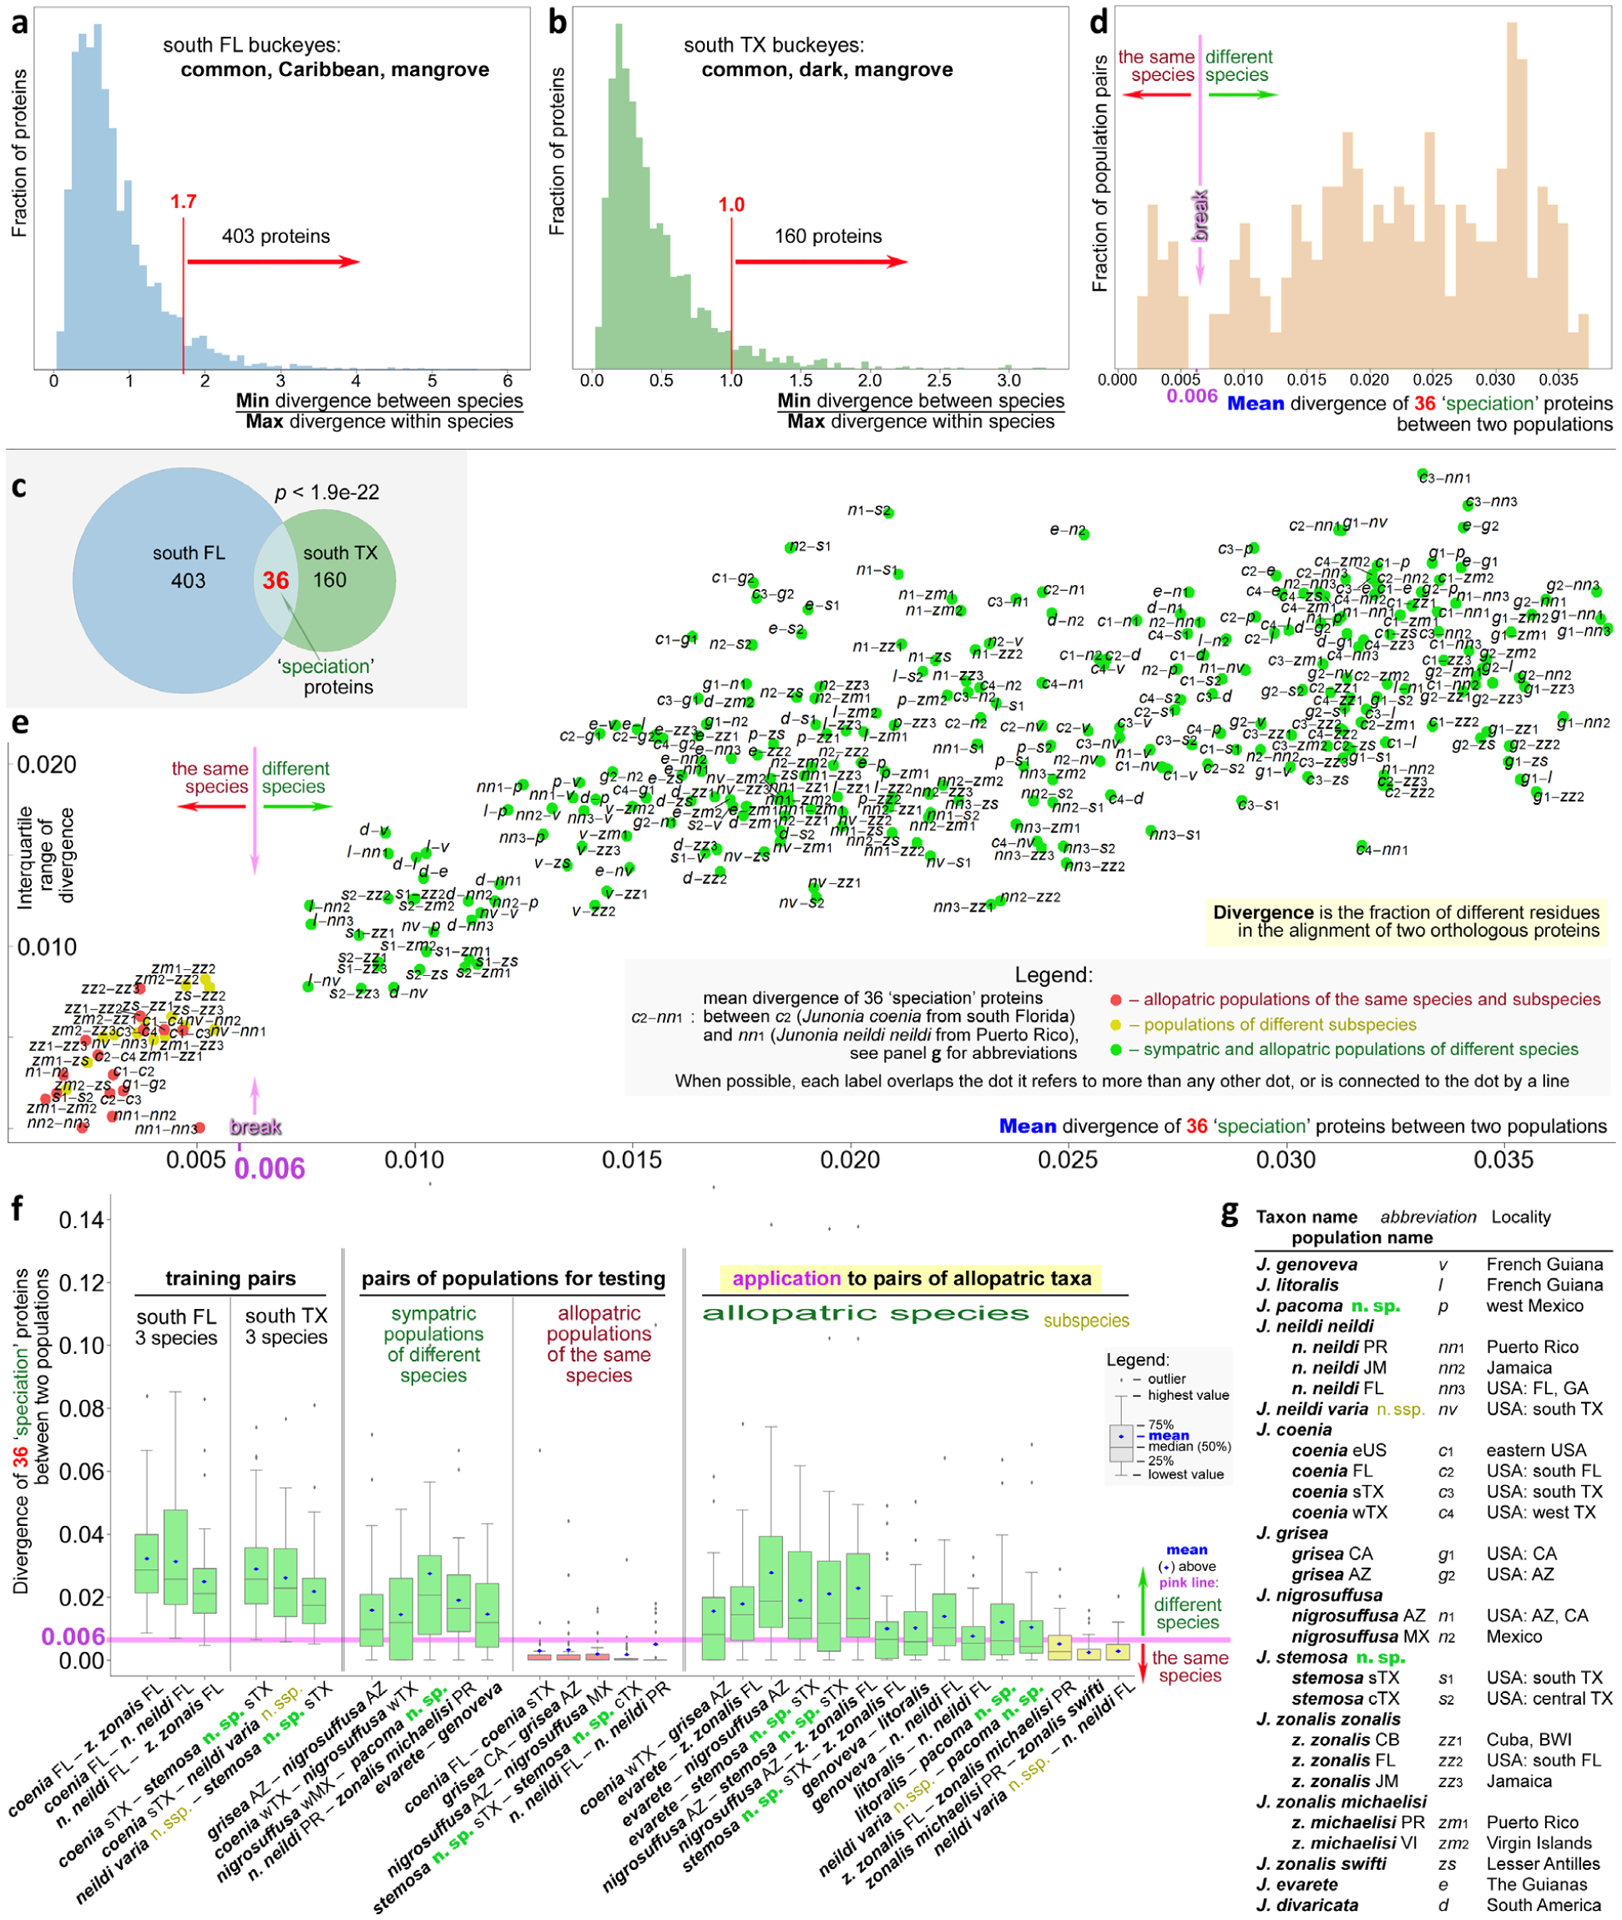
Delineating Junonia species and subspecies. Histogram of divergence in proteins among the sympatric populations of three species in south Florida (a) and south Texas (b). Cutoffs for selection of more diverging proteins are marked in red. (c) Venn diagram of the divergent proteins in three Florida and three Texas species showing a statistically significant overlap used to define 36 ‘speciation’ proteins. (d) Histogram of mean divergence of 36 ‘speciation’ proteins in all pairs of populations. The speciation cutoff around 0.006, revealed as a break in the distribution, is marked. (e) Standard deviation of divergence of 36 ‘speciation’ proteins versus the mean divergence shown for all pairs of populations listed and abbreviated in (g). (f) Boxplots for divergence of 36 ‘speciation’ proteins in selected pairs of populations. (g) Populations used in the analysis are shown in this figure with their abbreviations. In panels (d)–(f), green refers to a pair of populations of different species, yellow marks pairs of different subspecies and red indicates populations of the same species. Pink corresponds to the speciation cutoff.
