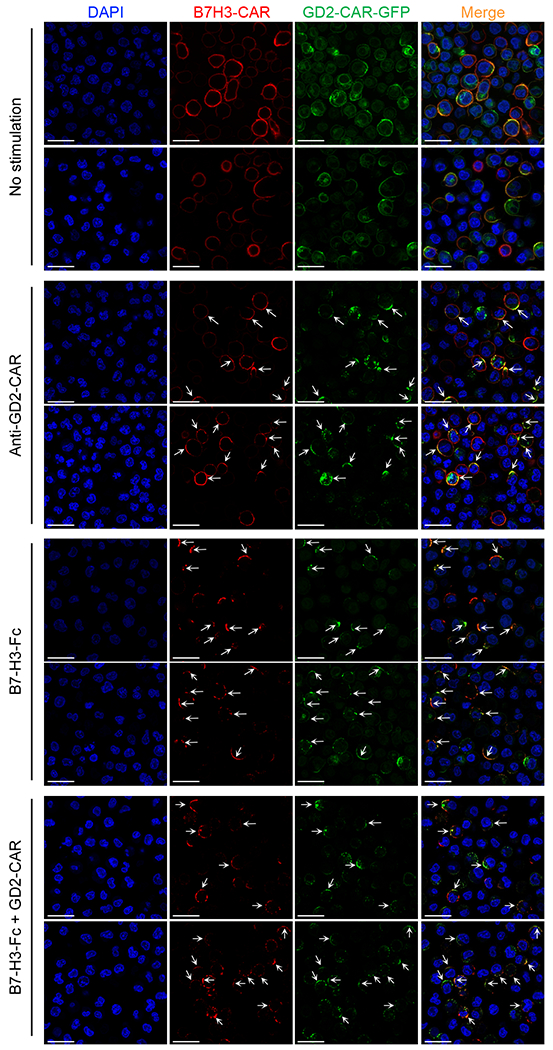
Extended Data Fig. 5. CAR clustering and aggregation in CAR-T cells after CAR engagement.

Representative confocal microscopy imaging showing CAR molecule clustering in T cells expressing GFP-tagged GD2.28ζ (green) and B7-H3.BB (red) with and without engagement of the CARs using either the anti-14g2a idiotype antibody (1A7) or the B7-H3.Fc protein. Blue staining indicates the DAPI. Shown are representative cells of a single field (Magnification 63X). Data are representative of three independent validations. Shown in white are the scale bars that correspond to 20 μm.
