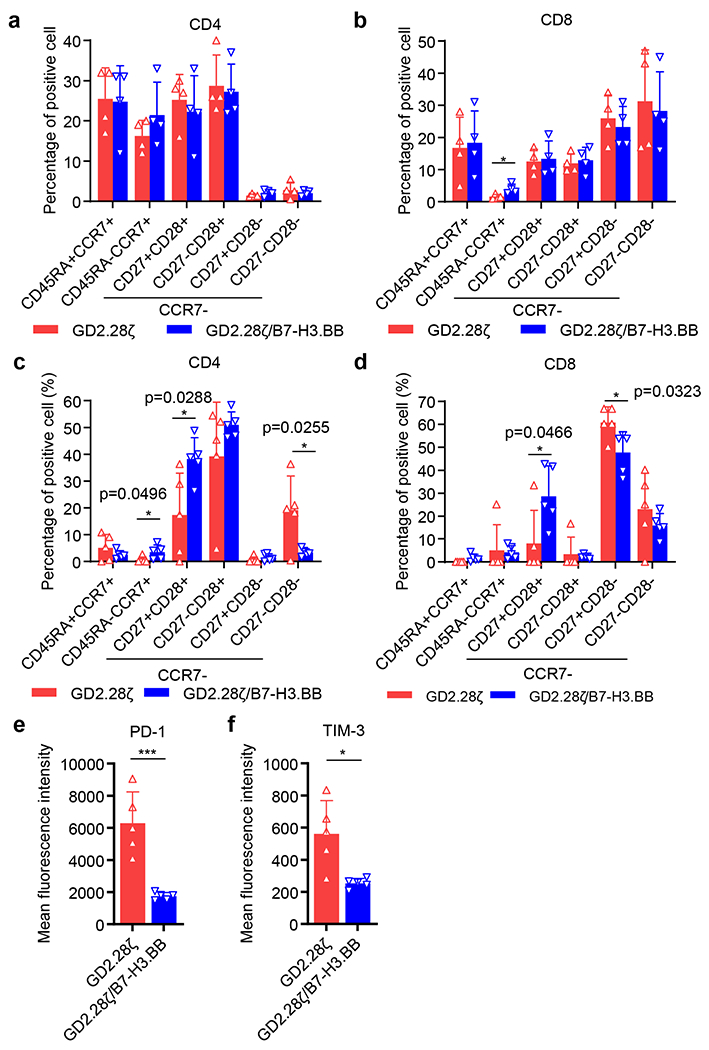
Extended Data Fig. 6. Phenotypic analysis of CAR-T cells in vitro and in vivo.

(a,b) Frequency of CD45RA+CCR7+, CD45RA−CCR7+, CCR7−CD28+CD27+, CCR7−CD28+CD27−, CCR7−CD28−CD27+, and CCR7−CD28−CD27− in CD4+ (a) and CD8+ (b) T cells on day 13 after retroviral vector transduction and expansion in vitro. Data are shown as individual values and the mean ± SD, n = 4 independent experiments using CAR-T cells generated from 4 different donors; *p = 0.0299, two-tailed p value determined by unpaired t test. (c-f) Tumor-baring mice infused with CAR-T cells were bled at day 14 and CAR-T cells in the peripheral blood were analyzed by flow cytometry. (c,d) Frequency of CD45RA+CCR7+, CD45RA−CCR7+, CCR7−CD28+CD27+, CCR7−CD28+CD27−, CCR7−CD28−CD27+, and CCR7−CD28−CD27− in CD4+ (c) and CD8+ (d) T cells. Data are shown as individual values and the mean ± SD, n = 5 samples from 5 mice, *p < 0.05, two-tailed p value determined by unpaired t test. (e,f) Mean Fluorescence Intensity (MFI) of PD-1 (e) and TIM-3 (f) in T cells. Data are shown as individual values and the mean ± SD, n = 5 samples from 5 mice; *p = 0.0109, ***p = 0.0008, two-tailed p value determined by unpaired t test.
