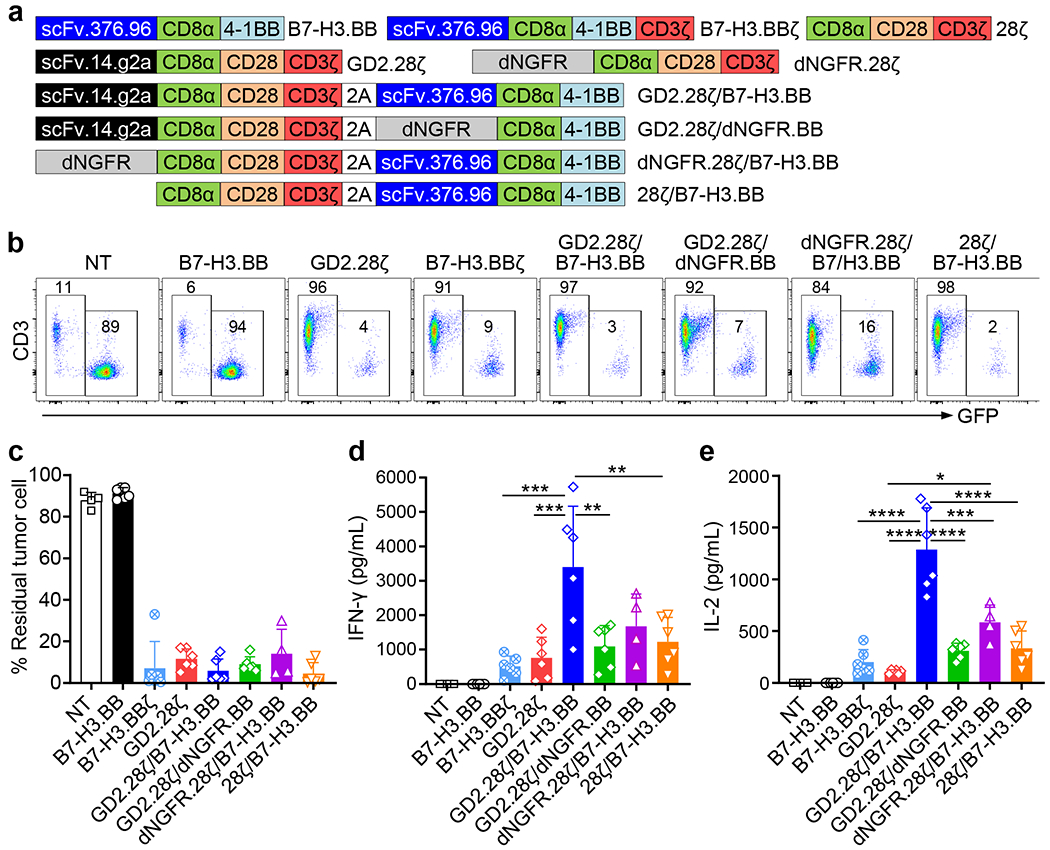
Figure 2. One single shared CD3ζ chain is sufficient for transducing the activation signal in dual specific CAR-T cells.

(a) Schematic representation of the retroviral vectors encoding B7-H3.BB, B7-H3.BBζ, GD2.28ζ, 28ζ, dNGFR.28ζ, GD2.28ζ/B7-H3.BB, GD2.28ζ/dNGFR.BB, dNGFR.28ζ/B7-H3.BB and 28ζ/B7-H3.BB. scFv.14.g2a, single-chain variable fragment of the anti-GD2 monoclonal antibody 14.g2a; scFv.276.96, single-chain variable fragment of the anti-B7-H3 monoclonal antibody 376.96; CD8α, the stalk and transmembrane region of human CD8α; CD28, intracellular domain of human CD28; 4-1BB, intracellular domain of human 4-1BB; CD3ζ, intracellular domain of human CD3ζ chain; dNGFR, extracellular domain of human nerve growth factor receptor. (b) Representative flow cytometry plots showing residual GFP-labelled CHLA-255 cells in co-culture experiments in which CAR-T cells and tumor cells were plated at the T cell to tumor cell ratio of 1 to 5, and tumor cells (GFP+) and T cells (CD3+) were numerated by flow cytometry at 5 days after co-culture. Representative of 4 independent experiments. (c-e) Summary of residual tumor cells (e), IFN-γ (d) and IL-2 (e) released by CAR-T cells in the co-culture experiments described in (B). NT, Non-transduced T cell; Data are shown as individual values and the mean + SD, n = 4 independent co-culture with CAR-T cells generated from 4 different donors for NT and dNGFR.28ζ/B7-H3.BB groups, n = 6 independent co-culture with CAR-T cells generated from 6 different donors for other groups; *p = 0.0119 in (e), **p = 0.0027 for GD2.28ζ/B7-H3.BB vs. GD2.28ζ/dNGFR.BB and **p = 0.0051 for GD2.28ζ/B7-H3.BB vs. 28ζ/B7-H3.BB in (d), ***p = 0.0002 for B7-H3.BBζ vs. GD2.28ζ/B7-H3.BB and ***p = 0.0005 for GD2.28ζ vs. GD2.28ζ/B7-H3.BB in (d), ***p = 0.0001 in (e), ****p <0.0001 in (c-e) by one-way ANOVA with Tukey’s multiple comparison test adjusted p value.
