
Figure 7. Dual targeting with split co-stimulation and shared CD3ζ promote CAR-T cell proliferation, and glycolytic and oxidative metabolism.
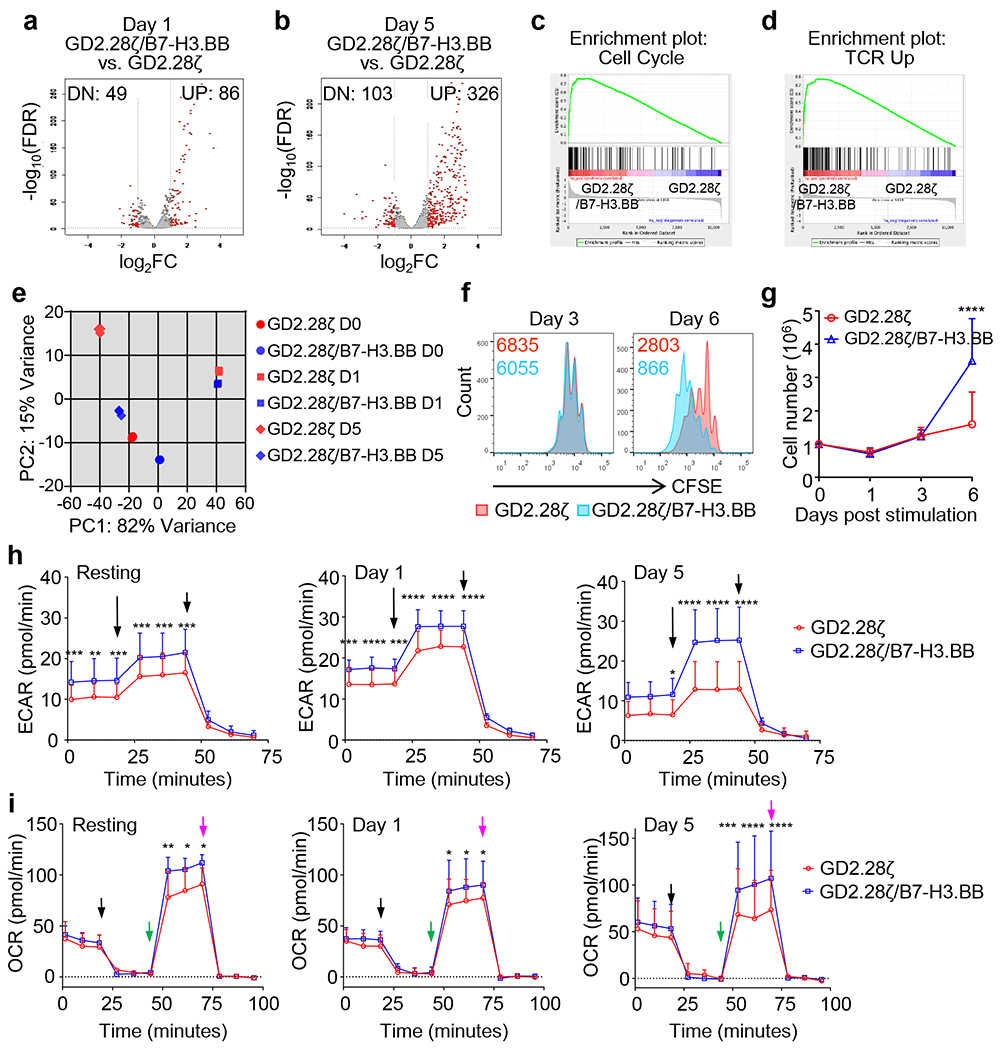
(a-d) RNAseq analysis of GD2.28ζ and GD2.28ζ/B7-H3.BB CAR-T cells at day 1 (a) and day 5 (b) after CAR stimulation. (c,d) GSEA of the cell cycle (c) and TCR (d) signaling five days after CAR stimulation. (e) Principal component analysis of transcriptome data from GD2.28ζ and GD2.28ζ/B7-H3.BB CAR-T cells at days 0, 1 and 5. (f,g) Proliferation of GD2.28ζ and GD2.28ζ/B7-H3.BB CAR-T cells after CAR stimulation. (f) CAR-T cells were stained with CFSE and then stimulated via 1A7 Ab and B7-H3-Fc protein on day 0, the CFSE dilutions were examined by flow cytometry on days 3 and 6 after stimulation. Representative of 4 independent experiments. (g) T cell numbers were counted by flow cytometry with counting beads in a separate experiment without CFSE staining (n = 5 independent experiments with CAR-T cells generated from 5 different donors), Error bars denote SD, *p < 0.0001 determined by multiple unpaired t test with Holm-Sidak correction for multiple comparison. (h, i) Metabolic profile showing glucose (h) and O2 consumption (i) of GD2.28ζ and GD2.28ζ/B7-H3BB CAR-T cells before CAR activation (resting), and days 1 and 5 after CAR activation. Extracellular acidification rate (ECAR) and O2 consumption rate (OCR) were assayed at different time points in a Seahorse XF24 analyzer, n = 3 independent experiments, Error bars denote SD, *p <0.05, **p <0.01, ***p <0.001,****p <0.0001, two-way ANOVA with Sidak correction for multiple comparison, the full list of p values can be found in the source data. The long and short arrows indicate the time point of adding Rot/AA and 2-DG respectively (h); the black, green and purple arrows indicate the time point of adding oligomycin, FCCP, Rot/AA respectively (i).