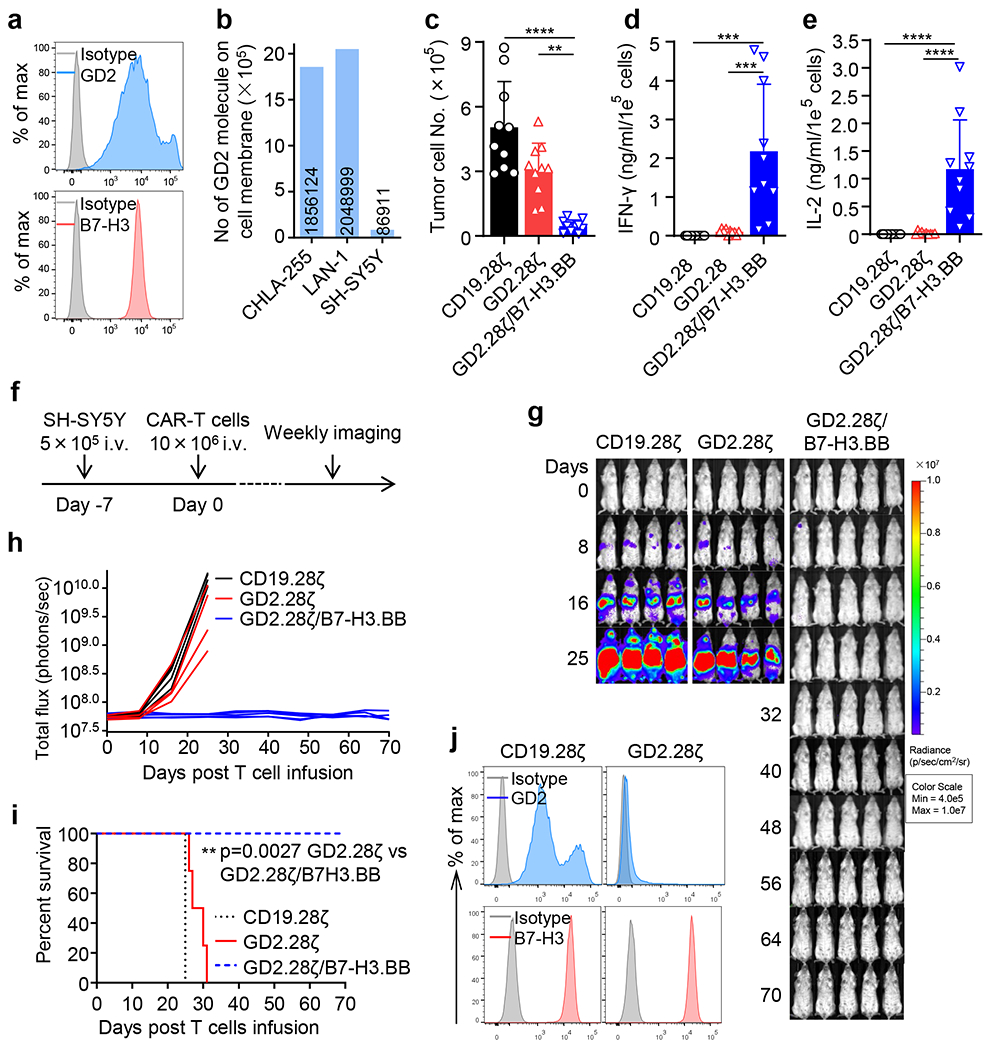
Figure 8. Dual targeting, split signaling and one single CD3ζ endodomain prevent tumor escape due to antigen loss.

(a) Flow cytometry histogram showing the expression of GD2 and B7-H3 in the NB cell line SH-SY5Y. Representative of 3 independent experiments. (b) Quantification of the GD2 density on the cell membrane of CHLA-255, LAN-1 and SH-SY5Y cells as measured by flow cytometry. The numbers within bars indicate the calculated number of GD2 molecules on the cell membrane of each cell line. Representative of 2 independent experiments. (c) Quantification of residual NB cells labelled with GFP and co-cultured with CD19.28ζ, GD2.28ζ and GD2.28ζ/B7-H3.BB CAR-T cells at the T cell to tumor cell ratio of 1 to 5. On day 5, NB cells (GFP+) and CAR-T cells (CD3+) were enumerated by flow cytometry. Data are shown as individual values and the mean + SD, n = 10 independent co-culture with CAR-T cells generated from 10 different donors; **p = 0.0011, ****p <0.0001 by one-way ANOVA with Tukey’s multiple comparison test adjusted p value. (d,e) Summary of IFN-γ (d) and IL-2 (e) released by CAR-T cells in the culture supernatant after 24 hours of co-culture with NB cells as measured by ELISA. Data are shown as individual values and the mean + SD, n = 10 independent co-culture with CAR-T cells generated from 10 different donors; ***p = 0.0001 for CD19.28ζ vs. GD2.28ζ/B7-H3.BB and ***p = 0.0002 for GD2.28ζ vs. GD2.28ζ/B7-H3.BB in (d), ****p <0.0001 in (e) by one-way ANOVA with Tukey’s multiple comparison test adjusted p value. (f) Schema of the SH-SY5Y metastatic xenograft NB model in NSG mice inoculated intravenously via tail vein with 5 x 10⁵ of FFLuc-SH-SY5Y cells and treated 7 days later with 1 x 10⁷ CD19.28ζ, GD2.28ζ and GD2.28ζ/B7-H3.BB CAR-T cells intravenously. (g,h) Representative tumor BLI images (g) and BLI kinetics (h) of FFLuc-SH-SY5Y tumor growth in the metastatic xenograft NB models shown in (f) (n = 4 or 5 mice/group). (i) Kaplan-Meier survival curve of mice in (g,h) (n = 4 or 5 mice/group); **p = 0.0027 by Log-rank test. (j) GD2 and B7-H3 expression levels in tumor cells collected from mice treated with CD19.28ζ or GD2.28ζ CAR-T cells were analyzed by flow cytometry at the time of the euthanasia. Representative of 3 independent experiments.
