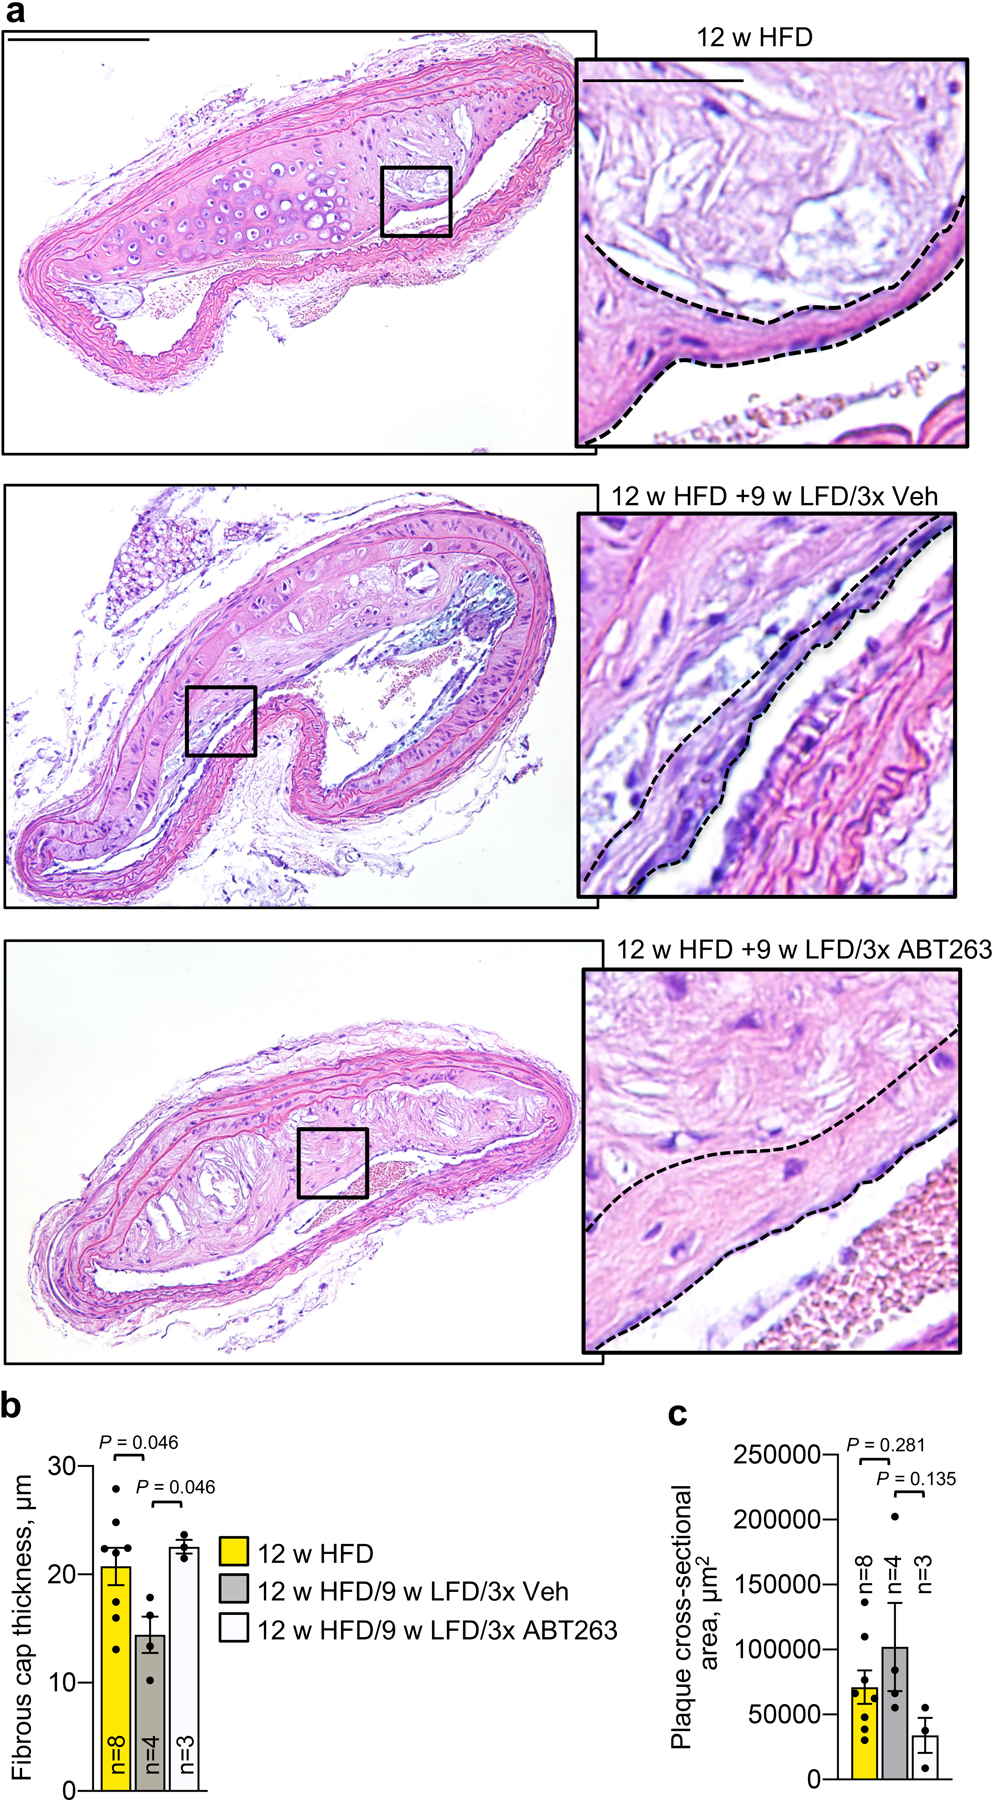
Extended Data Fig. 2: Senolysis blocks fibrous cap thinning in the brachiocephalic artery.

a, Representative H-E staining of brachiocephalic artery sections from 12-week HFD-fed Ldlr−/− mice and 12-week HFD-fed Ldlr−/− switched to LFD for 9 weeks with either administration of 3-cycles ABT263 or 3-cycles Veh (3x Veh); see Fig 1a for experimental design. Insets show a region of fibrous cap, outlined in black dashed lines and quantified in b. b, Quantification of fibrous cap thickness in brachiocephalic arteries from indicated groups. c, Quantification of average brachiocephalic plaque cross-sectional area per section in mice of indicated groups. “n” refers in all panels to number of mice. All statistics were performed by ordinary one-way ANOVA with Holm-Sidak multiple comparison correction for the indicated comparisons. Error bars represent s.e.m. Scale bars for a are 400 μm (main) and 100 μm (inset).
