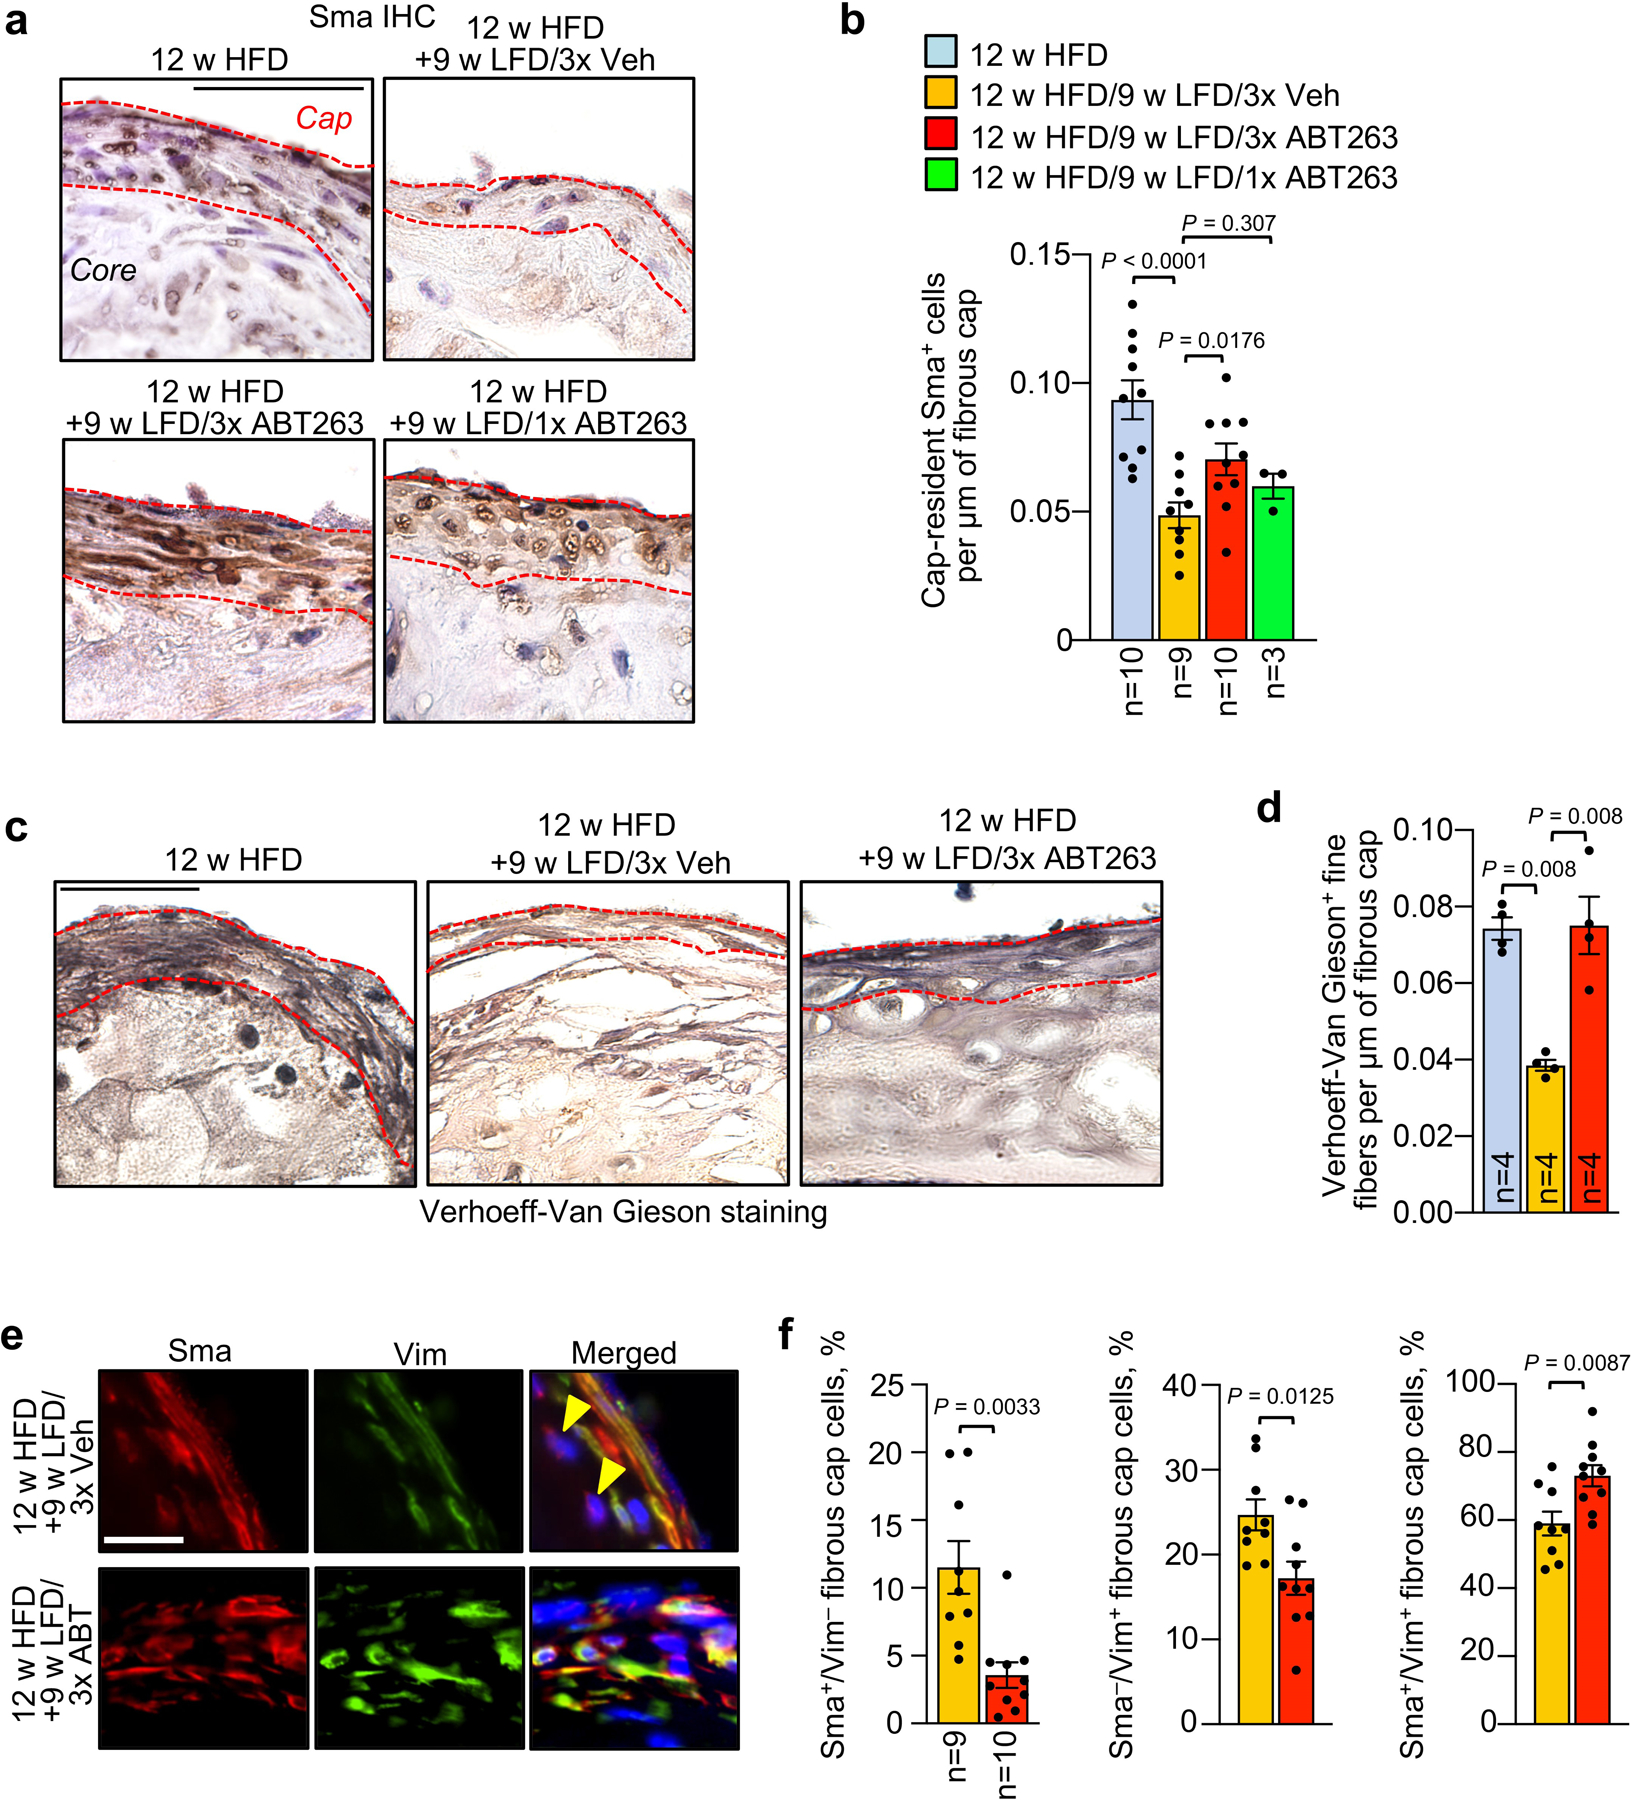
Extended Data Fig. 3: ABT263 blocks fibrous cap thinning in aortic arch lesions by maintaining elastogenic VSMC numbers.

a, Immunohistochemical staining for Sma (quantified in b) in fibrous caps (dashed red lines) from 12-week HFD baseline mice, as well as those remodeling for 9 weeks on LFD with three 7-day cycles of ABT263 or Veh (3x ABT263 and 3x Veh; LFD weeks 1,4, and 7), or one 7-day cycle of ABT263 (1x ABT; LFD week 1). b, Quantification of Sma+ cells per μm of fibrous cap length from the indicated mice. c, Representative Verhoeff-Van Gieson staining of fibrous caps from the indicated groups and quantified in d. d, Quantification of Verhoeff-Van Gieson-positive fine fibers in fibrous caps of the indicated groups (legend as in b). e, Representative Vimentin and Sma costaining in fibrous caps of mice of the indicated groups (quantified in f). Yellow arrowheads indicated Vim−/Sma+ fibrous cap cells. f, Quantification of the percentage of Sma+/Vim− (left), Sma−/Vim+ (middle), and Sma+/Vim+ (right) cells in fibrous caps from indicated groups (legend as in b). Arrowheads: Sma+/Vim− fibrous cap cells. “n” refers in all panels to number of mice. Statistics in panels b and d were performed by ordinary one-way ANOVA with Holm-Sidak multiple comparison correction for the indicated comparisons. Panel b includes data presented in Fig. 2f for context (12 w HFD baseline); here, ANOVA includes all indicated comparisons across Fig. 2f and Extended Data Fig. 3b. Panel f was analyzed by unpaired, two-tailed t-test with Welch’s correction. Error bars represent s.e.m.. Scale bar for a is 50 μm; c, 40 μm; and, e, 20 μm.
