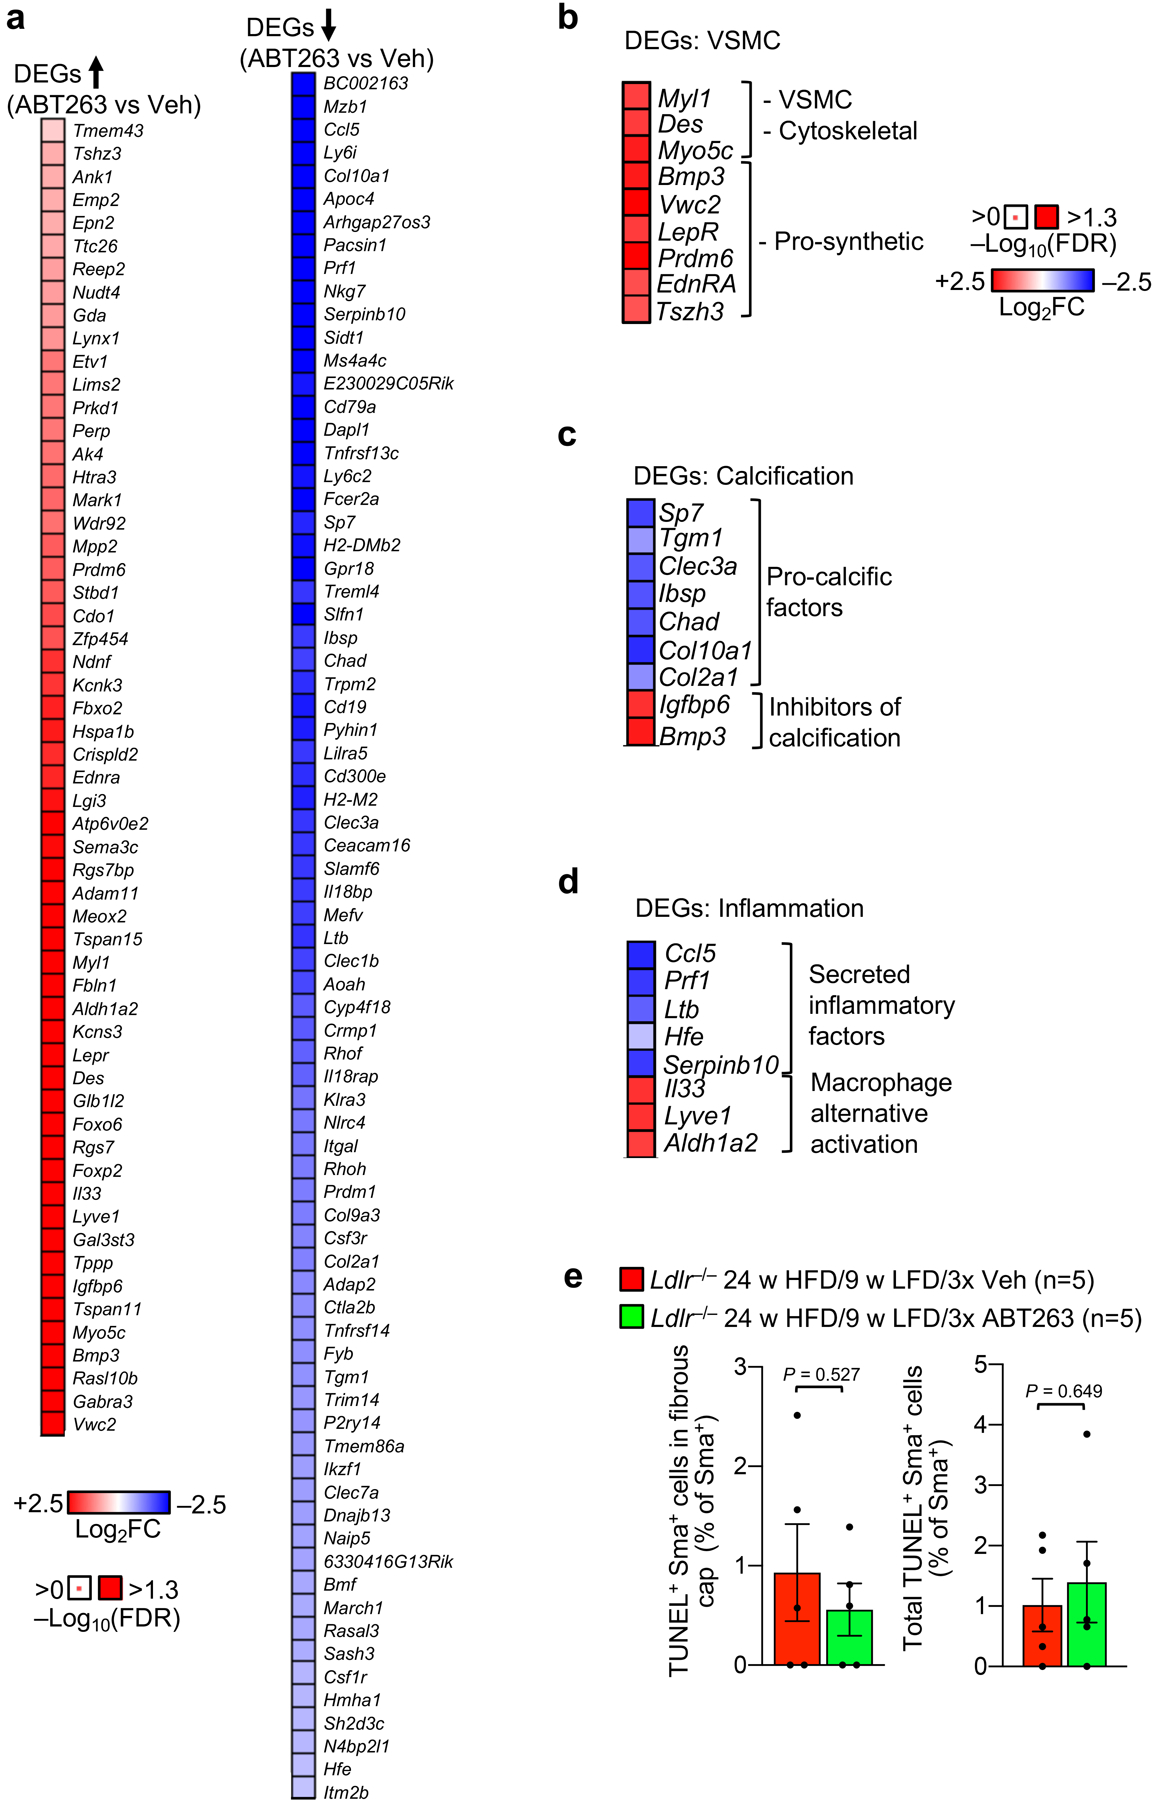
Extended Data Fig. 4: Transcriptome analysis indicates that ABT263 induces multiple favorable changes in plaque pathogenesis.

a, Heat map of differentially expressed genes upregulated (left) and downregulated (right) by ABT263 treatment in aortic arch plaque (see Fig. 3a for experimental schematic). b, Heat-map of pro-synthetic VSMC phenotype and muscle function genes upregulated with ABT263 treatment. c, Heat-map of anti-calcification changes in gene expression produced by ABT263 treatment among DEGs. d, Heat-map of pro-inflammatory and macrophage polarization DEGs modulated with ABT263 treatment in aortic arch plaque. e, Percentage of Sma+ cells showing TUNEL+ nuclei in fibrous caps (left) and total plaque (right) of indicated groups. Panel e (left and right) were assessed by unpaired, two-tailed Student’s t-test with Welch’s correction. Error bars represent s.e.m. “n” in all cases represents number of individual mice.
