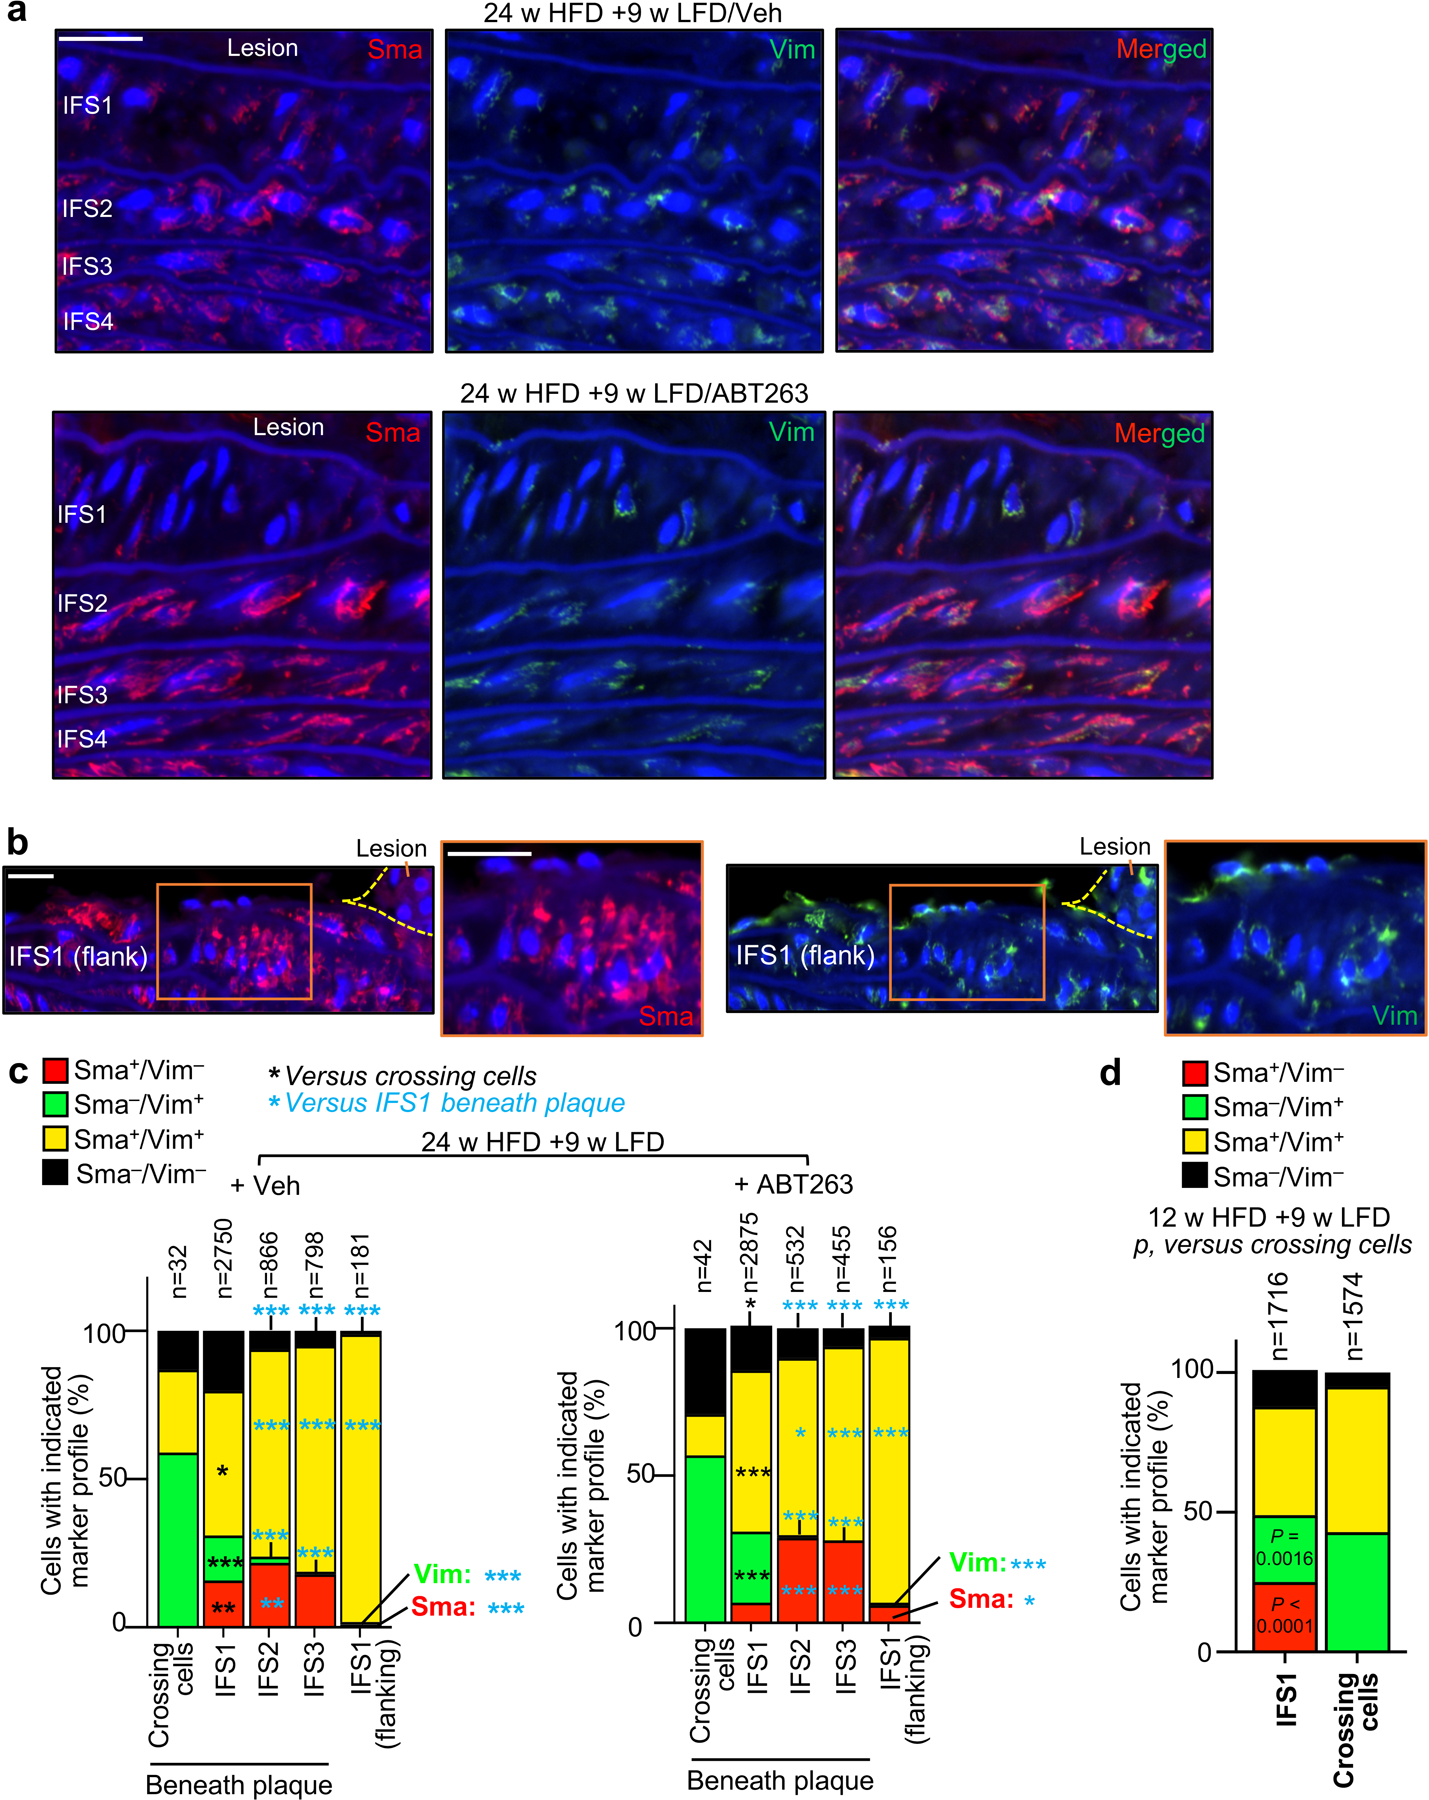
Extended Data Fig. 5: Contractile to promigratory phenotype switching of medial VSMCs is restricted to IFS1 underneath lesions.

a, Representative images of IFS1–4 beneath plaque of the indicated groups stained for Sma and Vim (quantified in c). b, Representative images of plaque-flanking IFS1 VSMCs stained for Sma and Vim (quantified in c). c, VSMC expression profile of Vim and Sma in cells crossing the first elastic fiber, interfiber spaces (IFS) 1 to 3 beneath plaques, and IFS1 flanking plaques separated by treatment group (ABT or Vehicle administration during LFD feeding weeks 1, 4, and 7, following 24 weeks HFD feeding. *, p <0.05; **, p <0.01; ***, p <0.001. Exact p-values are indicated in the raw data source file. d, VSMC expression profile of Vim and Sma in cells crossing the first elastic fiber versus interfiber space (IFS) 1 aggregated across treatment group (ABT or Vehicle administration during LFD feeding weeks 1, 4, and 7, following 12 weeks HFD feeding). Panels in c and d were analyzed by global x2, followed up by individual two-tailed Fischer’s exact tests. “n” represents individual cells analyzed per aortic compartment. Scale bars in a and b are 20 μm.
