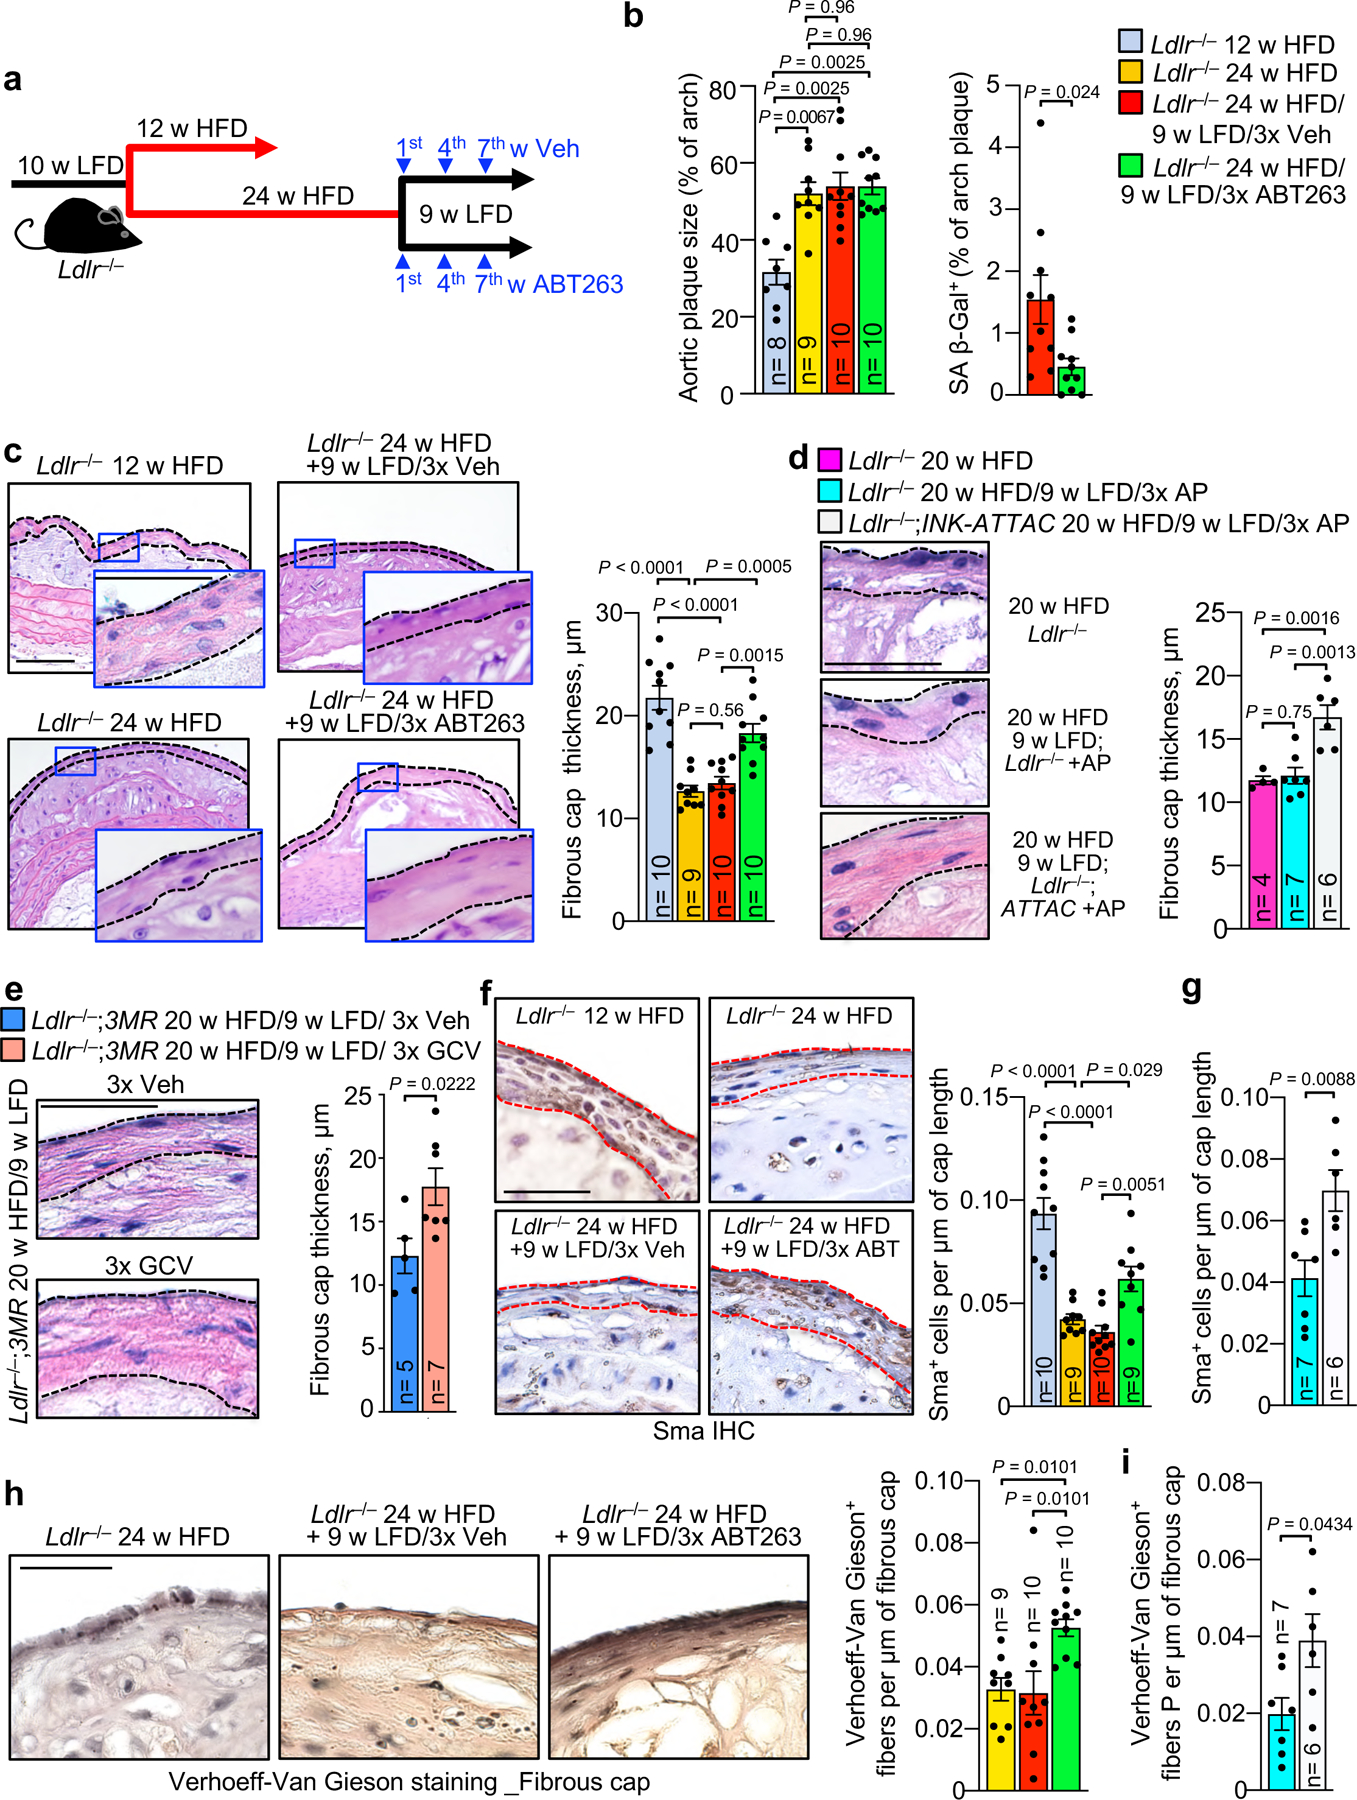
Figure 2: Fibrous caps of advanced atheromas increase VSMC content and thicken with senolysis.

a, Schematic of the experimental design for experiments presented in b and c. b, Total lesion area and % lesional SA β-Gal+ area in aortic arch for the indicated mouse cohorts. c, (Left) Images of representative H-E stained inner aortic arch lesions of the indicated mice. (Right) Quantification of cap thickness in inner aortic arch lesions of the indicated mice (legend as in b). d and e, (Left) Representative H-E stained images of fibrous caps from indicated mice. (Right) Quantification of cap thickness in inner aortic arch lesions of the indicated mice. f, Immune staining (left) and quantification (right) for Sma+ cell number per length of fibrous cap in fibrous caps from groups indicated in c. g, Quantification of Sma+ cells in fibrous caps of mice in indicated groups (legend as in d). h, Verhoeff-Van Gieson staining (left) and elastin fine-fiber quantification for mice of indicated groups (legend as in b). i, Verhoeff-Van Gieson staining quantification for mice of groups as indicated (legend as in d). “n” refers in all panels to number of mice. Panels b (left), c, d, f and h were analyzed by one-way ANOVA with Holm-Sidak multiple comparison correction. Panel b includes data presented in Fig. 1e for context (12 w HFD baseline). Panel c includes data presented in Fig. 1d and 1j for context (12 w HFD baseline). Panel f includes data presented in Extended Data Fig. 3b for context (12 w HFD baseline). For both panels b and c, ANOVA analysis includes all indicated comparisons across Fig.1 and 2. For panel f, ANOVA analysis includes all indicated comparisons across Fig. 2f and Extended Data Fig. 3b. Panels b (right), e, g, and i were analyzed by unpaired, two-tailed t-test with Welch’s correction. Error bars represent s.e.m. Scale bars: for c are 100 μm (main) and 50 μm (inset); for d, 50 μm; for e, 50 μm; for f, 50 μm; for h, 40 μm.
