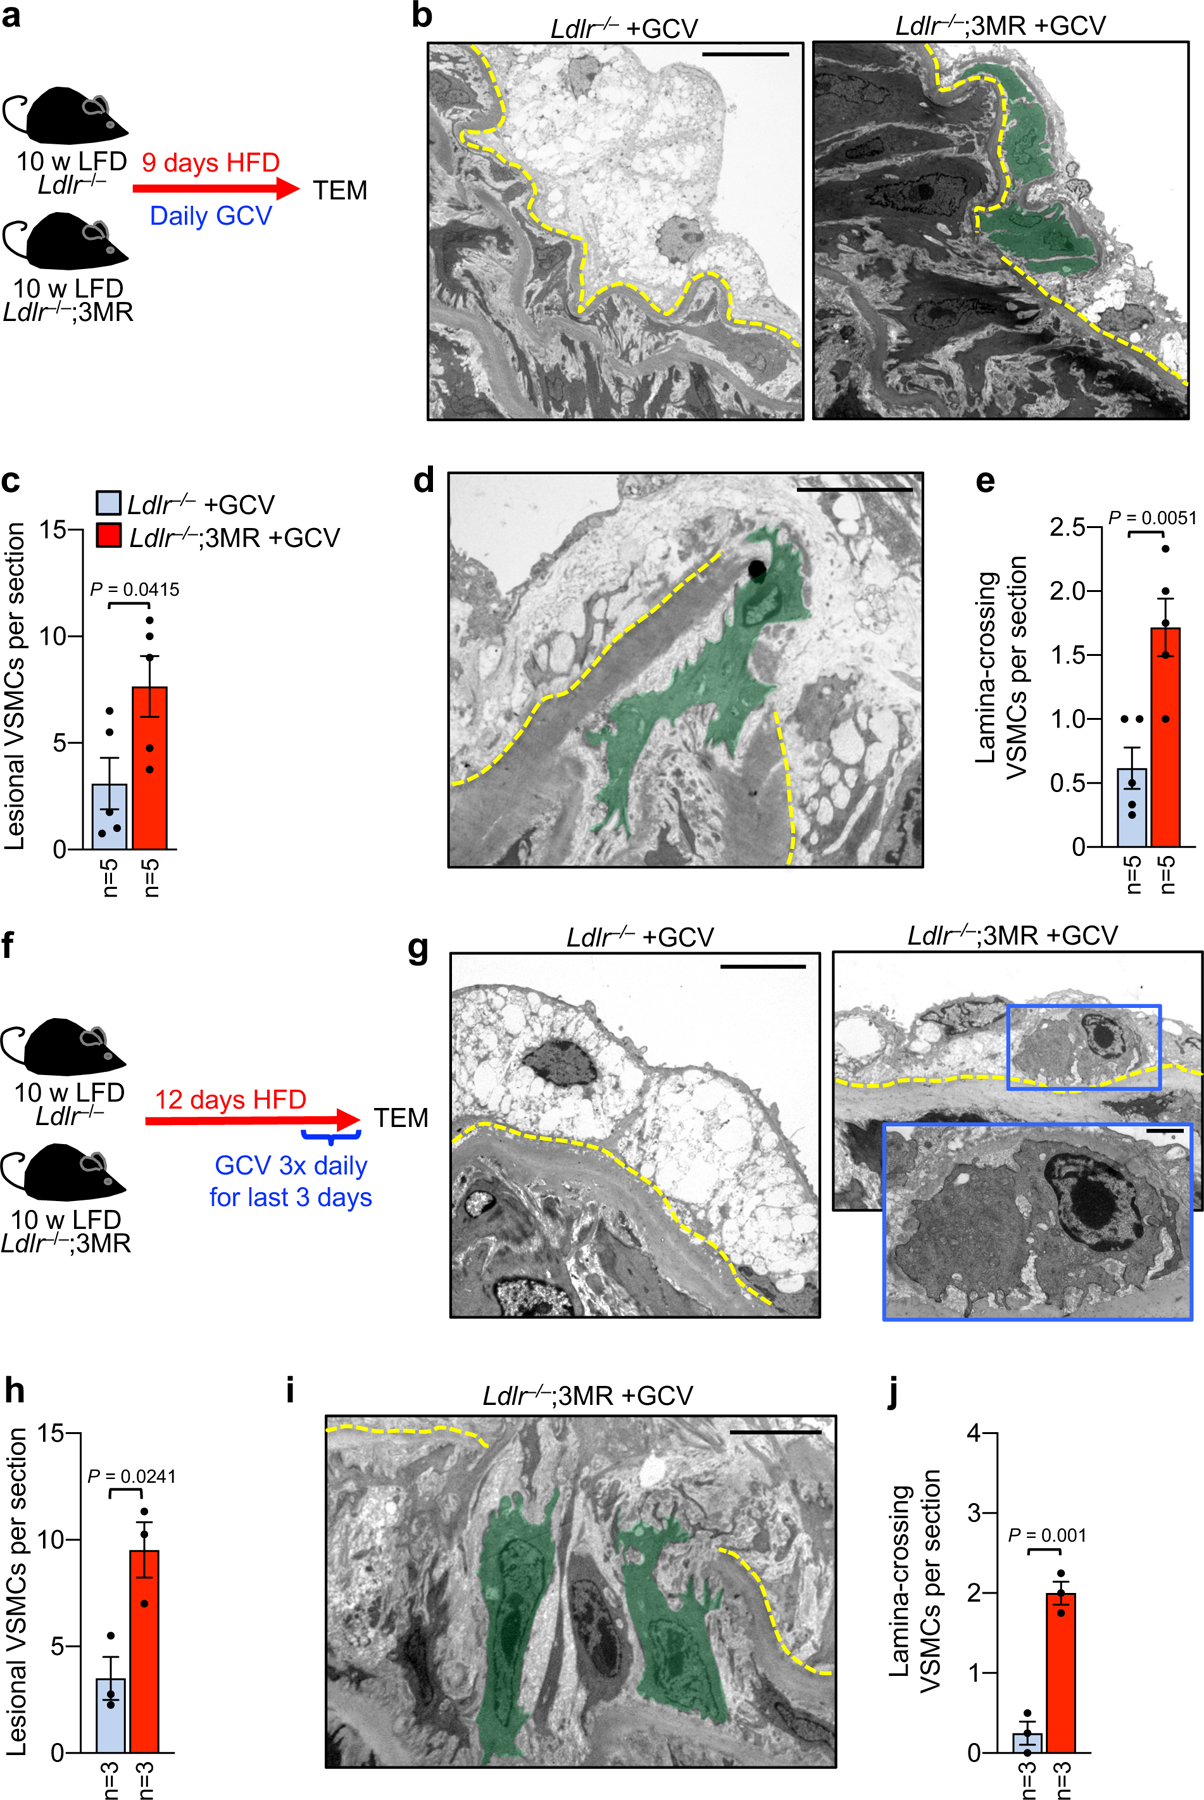
Figure 6: 3MR-mediated senolysis prompts rapid VSMC migration during early atherogenesis.

a, Schematic of 9-day HFD plaque formation assay using the p16–3MR transgene and ganciclovir (GCV) to constitutively clear SNCs. b, Representative transmission electron micrographs of indicated groups showing foam cell macrophage-rich fatty streak (left) and VSMCs (green masks, right) infiltrating the subendothelium (quantified in c). c, Quantification of VSMC infiltration in mice of indicated groups. d, Representative electron micrograph of a medial VSMC traversing the first elastic lamina in a 9-day HFD Ldlr−/−;3MR mouse treated with GCV (quantified in e). e, Number of VSMCs crossing the first elastic lamina in mice of indicated groups (legend as in c). f, Schematic of the experimental approach designed to test the acute impact of high-intensity SNC clearance on pre-existing early inner aortic arch lesions. g, Representative transmission electron micrographs of indicated groups showing a foam cell macrophage-rich fatty streak in the absence of senolysis (left) and VSMC presence in the subendothelium with SNC clearance (right, magnified in inset; quantified in h). h, Quantification of VSMCs in the subendothelial space of the indicated mice. i, Representative TEM micrograph of IFS1 VSMCs (green masks; quantified in j) crossing the first elastic lamina (yellow dashed line) in a 9+3-day HFD Ldlr−/−;3MR mouse treated with GCV. j, Number of VSMCs crossing the first elastic lamina in mice from indicated groups. Error bars represent s.e.m.. Statistics in all panels were performed by unpaired, two-tailed t-test with Welch’s correction. “n” in all cases is the number of mice. Scale bar in b is 10 μm; in d, 2 μm; in g, 5 μm; and, in i, 5 μm. Scale bar in g (inset) is 1 μm.
