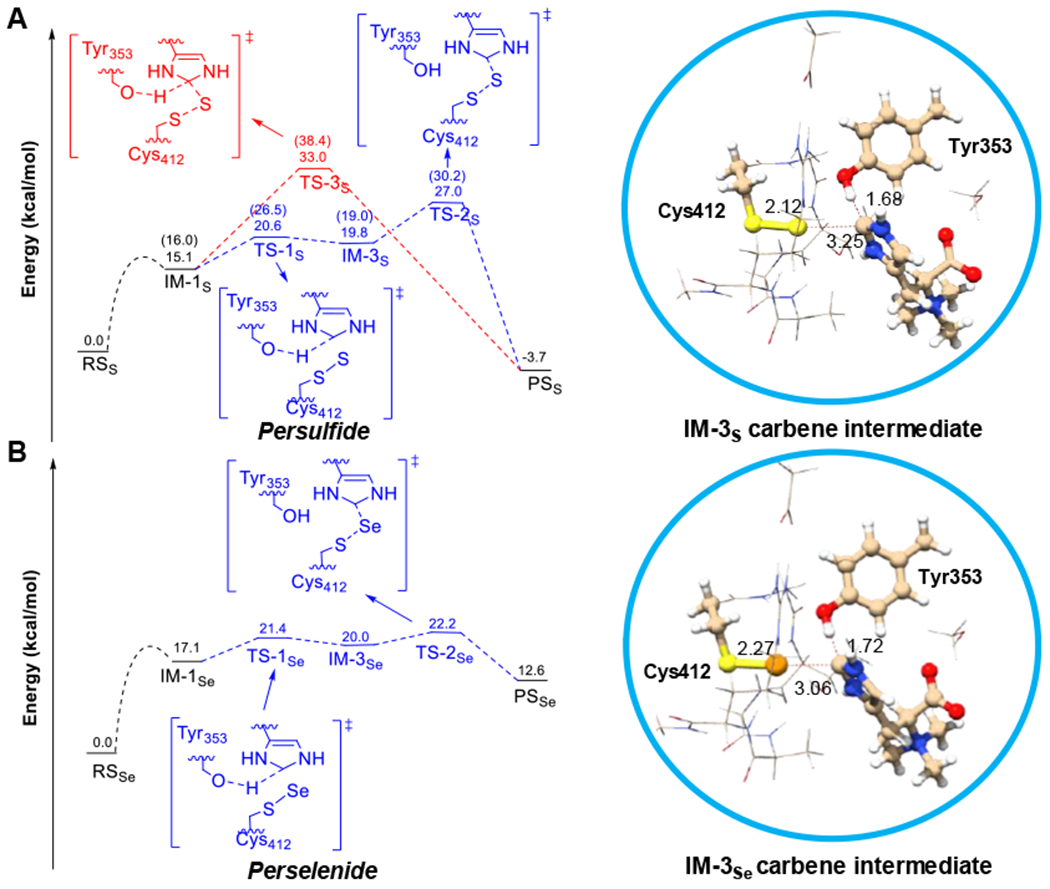
Figure 3. The potential energy profile for EanB-catalysis using a cluster model at the B3LYP-D3/6-31+G(d,p) level of theory.

The protein environment was described by CPCM with a dielectric constant of 4.0. (A) EanB with Cys412 persulfide; Note: the numbers in the bracket are free energies (ΔG) from previous DFTB3/MM metadynamics simulation. (B) EanB with the Cys412 perselenide. Subscript “S” represents species in C-S bond formation of EanB catalysis and subscript “Se” represents species in C-Se bond formation of EanB catalysis.
